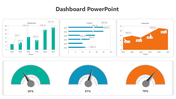
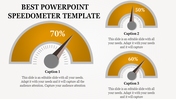
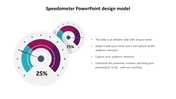
Editable PowerPoint Dashboard Templates for Data Analysis

Slide with a businesswoman standing beside a colorful ring chart labeled on a board and four captions on the right.
P.ID : 13479
    411 views
    27 Downloads
    Get Custom Slides by Experts
    Instantly Access Templates in PowerPoint

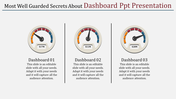
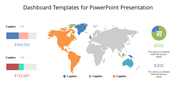
    Dashboard Presentation Template

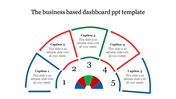
    Our Dashboard PowerPoint templates make it easy to turn complex data into clear, eye-catching dashboards PPT. Picture this: a professional woman presenting data on a board, surrounded by four text boxes you can customize. You can fill these with your key performance indicators or project milestones. The colourful design adds personality, but the layout stays clean for easy understanding.

    Whether you're in business, managing projects, or leading sales, these templates help you share data insights effectively. You can tweak the colors, fonts, and icons to match your brand or theme. Show off sales numbers, marketing results, financial info—whatever matters to your audience. Want to make data visualization a breeze? Download the PowerPoint template now and make your presentations powerful decision-making tools!

    Features of the template:

    • Slides are available in different nodes & colors.
    • Easy to change the slide colors.
    • Well-crafted template with instant download.
    Advertisement

    You May Also Like These PowerPoint Templates

    Add to Wishlist
    Download
    AI Customize
    Purple themed dashboard slide featuring multiple charts and a text box for descriptive content.
    Add to Wishlist
    Download
    AI Customize
    Dashboard slide with three blue icons and captions paired with a bar chart on a tablet screen, and a desk setup on the right.
    Add to Wishlist
    Download
    AI Customize
    Yellow speedometer graphic indicating 70%, with a gray needle pointing right and a caption area below.
    Add to Wishlist
    Download
    AI Customize
    Black circular speedometer gauge with a green needle, surrounded by six captions on a white background.
    Free
    Add to Wishlist
    Download
    AI Customize
    Circular speedometer infographic with a black needle, yellow progress arc, and distance markers, next to an text box.
    Add to Wishlist
    Download
    AI Customize
    Sales performance dashboard PowerPoint template with a line graph, pie chart, and percentage change analysis.
    Add to Wishlist
    Download
    AI Customize
    Speedometer PowerPoint template with yellow background showing a 70 percent reading, along with 50 and 60 percent gauges.
    Add to Wishlist
    Download
    AI Customize
    Executive dashboard featuring a bar chart of project tasks, pie chart for project distribution, and a line graph.
    Free
    Add to Wishlist
    Download
    AI Customize
    Speedometer graphic with a blue progress bar, labeled distance values, and a right-side text box explaining its concept.
    Add to Wishlist
    Download
    AI Customize
    Circular tachometer gauge with a needle pointing six colored sections, and captions in rounded rectangles connected by lines.
    Free
    Add to Wishlist
    Download
    AI Customize
    Circular gauge style infographic in shades of gray, showing a speedometer with a needle and distance markers.
    Add to Wishlist
    Download
    AI Customize
    Business executive dashboard template displaying project information, including date and editor with placeholder text.
    Add to Wishlist
    Download
    AI Customize
    Dashboard themed slide with a semi circular gauge showing four icons for speedometers and a central needle pointer.
    Add to Wishlist
    Download
    AI Customize
    Dashboard layout with gauges, bar charts, line graphs, and progress indicators for business performance metrics.
    Add to Wishlist
    Download
    AI Customize
    Green speedometer graphics illustrating performance levels at 70, 50, 55, and 85 percent in a PowerPoint template.
    Add to Wishlist
    Download
    AI Customize
    A tachometer graphic for PowerPoint, featuring different colored sections and text placeholders.
    Add to Wishlist
    Download
    AI Customize
    Four yellow speedometer graphics showing percentages of 70%, 50%, 55%, and 85% placed in a white background.