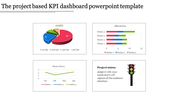
Attractive Project Dashboard PowerPoint Template Design

Dashboard template with two horizontal bar charts, a calendar icon, and circular progress indicators in orange and green.
P.ID : 41726
    13 slides
    Bar chart PowerPoint slides showcasing different business categories with colorful bars in different layout designs.
    56 slides
    Slide deck with KPI charts and graphs for business analysis, including financials, HR performance, and customer service.
    36 slides
    Editable Linear Dashboard Infographics PowerPoint Template
    275 views
    24 Downloads
    Get Custom Slides by Experts
    Instantly Access Templates in PowerPoint

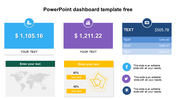
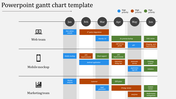
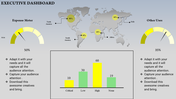
    Flat Dashboard Slide For Your Needs

    Presenting your project data in a fancy way will grab people's focus. So here we have made a fancy and creative project dashboard PowerPoint template to present your data visually. The beautiful gradients on this slide will enrich your data. It can add an innovative touch to your presentation. Also, you can customize the slide design and make it perfectly fit your necessities.

    Features of the template

    • 100% customizable slides and easy to download.
    • Slides are available in different nodes & colors.
    • The slide contained 16:9 and 4:3 formats.
    • Easy to change the slide colors quickly.
    • It is a well-crafted template with an instant download facility.
    • It is a 100% pre-designed slide.
    • The slide includes colorful icons.
    Advertisement

    You May Also Like These PowerPoint Templates

    Free
    Add to Wishlist
    Download
    AI Customize
    Dashboard layout includes a line graph, pie chart, and three bar graphs, all colored in red, green, and blue.
    Free
    Add to Wishlist
    Download
    AI Customize
    Project dashboard slide for electricity data with bar graphs showing units and amounts for different categories and months.
    Add to Wishlist
    Download
    AI Customize
    Chart infographic comparing data with orange and blue bars, alongside expense and budget details on the right.
    Add to Wishlist
    Download
    AI Customize
    KPI dashboard template with progress bars, pie chart, bar graphs, and workload metrics in a clean blue theme.
    Add to Wishlist
    Download
    AI Customize
    Dashboard slide showing business performance, including technology, accessibility, and security scores with activity graphs.
    Add to Wishlist
    Download
    AI Customize
    KPI dashboard slide featuring six charts vertical bars, horizontal bars, area graph, pie chart, and column bar graphs.
    Free
    Add to Wishlist
    Download
    AI Customize
    A professional comparison slide featuring horizontal bar graphs displaying various percentages alongside captions with icons.
    Add to Wishlist
    Download
    AI Customize
    KPI dashboard highlighting supplier statistics using donut charts, order-to-invoice process, and bar charts.
    Free
    Add to Wishlist
    Download
    AI Customize
    Dashboard with four sections showing charts, icons, and metrics in purple, red, green, and teal.
    Free
    Add to Wishlist
    Download
    AI Customize
    A slide with a sleek dashboard design that includes colorful data visualizations like pie charts, graphs, and progress bars.
    Free
    Add to Wishlist
    Download
    AI Customize
    KPI dashboard with percentage stats, bar charts, and flow diagrams in red, blue, and orange representing data trends.
    Add to Wishlist
    Download
    AI Customize
    KPI dashboard slide displaying supplier metrics with colorful pie charts, bar graphs, and a process flow with percentages.
    Free
    Add to Wishlist
    Download
    AI Customize
    KPI slide displaying three circular meters with red, green, and orange sections, with text descriptions on the right.
    Add to Wishlist
    Download
    AI Customize
    Company Annual Report slide featuring sections for overview, financial review, team management, and service offerings.
    Free
    Add to Wishlist
    Download
    AI Customize
    Project plan Gantt chart template with timeline, color coded tasks descriptions, and milestones spanning from 2017 to 2019.
    Free
    Add to Wishlist
    Download
    AI Customize
    Annual report slide displaying a bar chart with color-coded percentages from 30% to 80% and caption areas.
    Free
    Add to Wishlist
    Download
    AI Customize
    A detailed Gantt chart slide illustrating project timelines with tasks spanning different durations for 2021 and 2022.