Chart PowerPoint Template And Google Slides Themes

Infographic chart with a truck carrying five colorful blocks and percentage bars, using green, orange, and brown tones.
P.ID : 34313
    1.5K+ views
    169 Downloads
    Get Custom Slides by Experts
    Instantly Access Templates in PowerPoint

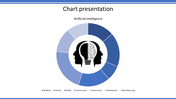
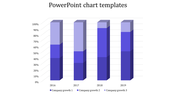
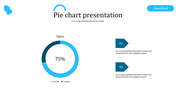
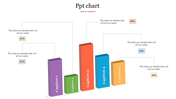
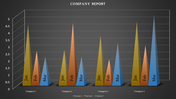
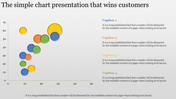
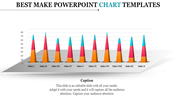
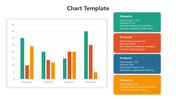
    Chart Presentation Template


    In today's world where data is super important, being able to show complicated information simply and effectively is valuable. Enjoy our chart presentations and Google slides. They're like a toolkit full of pictures that make your presentations awesome and stick in people's minds.

    It's got chart graphs that work together. With these slides, you can help people understand how transport systems move and change. These slides are made for all kinds of people, like business consultants, logistics managers, and even students studying transportation. No matter if you're talking to businessmen or classmates, these slides give you a clear way to explain your ideas.

    Use the magic of pictures to tell your story and make your presentations stick in people's heads. Check out our collection of awesome chart layouts in transport models by hitting the download button below. Make your presentations better, grab your audience's attention, and achieve success with presentations.

    Features of the template

    • Slides are available in different nodes & colors.
    • Easy to change the slide colors.
    • Well-crafted template with instant download.
    Advertisement

    You May Also Like These PowerPoint Templates

    Add to Wishlist
    Download
    AI Customize
    Slide displaying two pie charts with quarter wise performance data, along with performance percentages at the bottom.
    Add to Wishlist
    Download
    AI Customize
    Slide featuring a businessman pointing at a board with a pie chart and two circular progress visuals in red and yellow.
    Add to Wishlist
    Download
    AI Customize
    PowerPoint slide showcasing a chart with project status trends and a progress bar for each year.
    Add to Wishlist
    Download
    AI Customize
    Slide featuring three green pie charts and a line graph below, illustrating data trends for different categories.
    Add to Wishlist
    Download
    AI Customize
    Colorful timeline PowerPoint chart illustrating shifts for various employees throughout the day with peak hours highlighted.
    Free
    Add to Wishlist
    Download
    AI Customize
    Business plan infographic with a four-quadrant layout labeled with sales strategies and a 3D pie chart on the right.
    Add to Wishlist
    Download
    AI Customize
    Four panel chart slide featuring a line, bar, and pie chart, each displaying data trends and comparisons.
    Free
    Add to Wishlist
    Download
    AI Customize
    Bar graph showing revenue and sales data for 3D Ocean, Web, Graphics, Video, and Design in a business plan presentation.
    Free
    Add to Wishlist
    Download
    AI Customize
    Green bar graph depicting growth over six months, with two gear icons and captions on the left.
    Add to Wishlist
    Download
    AI Customize
    Donut chart showing sales distribution across four quarters with blue, orange, gray, and yellow segments.
    Free
    Add to Wishlist
    Download
    AI Customize
    Chart slide with four interlinked circular diagrams, and two radar charts in blue and green at the bottom.
    Free
    Add to Wishlist
    Download
    AI Customize
    Pie chart with four segments in white and green on a dark patterned background, alongside a text box for description.
    Free
    Add to Wishlist
    Download
    AI Customize
    World map infographic surrounded by six segments with icons for business-related captions and caption areas.
    Free
    Add to Wishlist
    Download
    AI Customize
    Pyramid infographic with four golden pyramids in ascending order, marked with percentages 10% to 40% on a dark base.
    Add to Wishlist
    Download
    AI Customize
    Slide featuring a financial report with bar charts and a table, showing website and a percentage statistic on the right.
    Free
    Add to Wishlist
    Download
    AI Customize
    Horizontal bar chart with green and gray bars of varying lengths, labeled with placeholder text, on a light background.
    Add to Wishlist
    Download
    AI Customize
    Four pencil-shaped bars for education in orange, blue, red, and green representing data from 2011 to 2014 with values.
    Free
    Add to Wishlist
    Download
    AI Customize
    Pie chart PPT slide with four sections in different colors and percentages, with accompanying text labels for each section.
    Add to Wishlist
    Download
    AI Customize
    Pie Chart PPT Presentation Template for Data Analysis