Free - Editable PPT Chart Templates Presentation Diagrams

Free
Horizontal bar chart with green and gray bars of varying lengths, labeled with placeholder text, on a light background.
P.ID : 3555
    366 views
    69 Downloads
    Get Custom Slides by Experts
    Instantly Access Templates in PowerPoint

    Visualize Data Effectively with Our Chart PowerPoint Template and Google Slides 


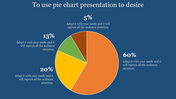
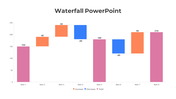
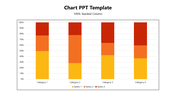
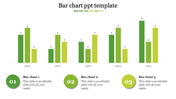
    Charts are indispensable tools for presenting data clearly and compellingly. Our Chart PowerPoint Template and Google Slides Themes are designed to enhance your data visualization needs. This template features a green-themed bar chart, allowing for seamless text and data customization to suit your specific requirements. Ideal for business reports, educational presentations, and analytical reviews, it ensures that your data is communicated effectively and professionally.

    Empower your audience to quickly grasp complex information with a visually appealing design highlighting key insights. Perfect for sales reports, performance metrics, and market analysis, our template supports accurate and dynamic data representation. Elevate your presentations with our Chart PowerPoint Template and Google Slides Themes, transforming your data into impactful visual stories.


    Features of this template:


    • 100 % customizable slides are easy to download. 
    • Slides are available in different nodes and colors.
    • The slide was contained in 16:9 and 4:3 formats.
    • It is easy to change the slide colors quickly.
    • Well-crafted template with an instant download facility.
    • The clear layout of this template will help you design a professional-looking presentation.
    • The multi-color visuals on this slide will make your presentation eye-catching.
    Advertisement

    You May Also Like These PowerPoint Templates

    Add to Wishlist
    Download
    AI Customize
    Slide with pie charts, line graphs, and a bar chart in shades of green, illustrating data trends and comparisons.
    Add to Wishlist
    Download
    AI Customize
    Six month Gantt chart with bars in blue, green, red, orange, and teal, arranged for task tracking.
    Free
    Add to Wishlist
    Download
    AI Customize
    Infographic of a bar chart representing yearly growth from 2018 to 2021 with a businesswoman illustration.
    Add to Wishlist
    Download
    AI Customize
    Circular pie chart divided into five colored sections noted with percentages, with corresponding boxes for text area.
    Free
    Add to Wishlist
    Download
    AI Customize
    3D bar chart PowerPoint template showcasing data in four colored categories with a highlight and captions.
    Free
    Add to Wishlist
    Download
    AI Customize
    Horizontal chart with dual color bars in green and blue, displaying percentage values, and two captions on the right.
    Add to Wishlist
    Download
    AI Customize
    Slide with a vertical bar chart and four labeled sections, each paired with a unique color and icon.
    Free
    Add to Wishlist
    Download
    AI Customize
    A blue themed slide featuring a multi year bar chart comparison from 2016 to 2021 with three placeholders below.
    Free
    Add to Wishlist
    Download
    AI Customize
    3D chart with five colored bars in gold, red, green, teal, and orange, on individual bases, displaying percentages above.
    Add to Wishlist
    Download
    AI Customize
    Innovative KWL Chart PowerPoint Presentation Slide
    Add to Wishlist
    Download
    AI Customize
    Area chart with overlapping blue, teal, and green sections, timeline on the axis, and three labeled boxes below.
    Add to Wishlist
    Download
    AI Customize
    A PowerPoint template displaying growth with stages represented by numbered circles showing data for different stages.
    Add to Wishlist
    Download
    AI Customize
    Color coded KWL chart template with sections for What I Know, What I Want to Know, and What I Learned with placeholder text.
    Add to Wishlist
    Download
    AI Customize
    Pie chart slide showcasing six labeled segments in yellow and gray with surrounding icons, on a blue networked background.
    Add to Wishlist
    Download
    AI Customize
    Pie chart slide with four numbered pie charts in blue, maroon, orange, and red, each linked to a text box with labels.
    Add to Wishlist
    Download
    AI Customize
    A slide with a line chart slide showing data for Category 1 to 2 over several years with placeholder text.
    Add to Wishlist
    Download
    AI Customize
    Innovative Pie Chart Presentation Example Slide PPT