Creative PowerPoint Chart Templates Presentation

A slide with a line chart slide showing data for Category 1 to 2 over several years with placeholder text.
P.ID : 5572
    269 views
    6 Downloads
    Get Custom Slides by Experts
    Instantly Access Templates in PowerPoint

    PowerPoint Chart Templates and Google Slides

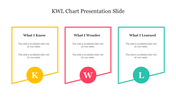
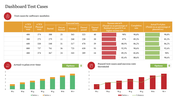
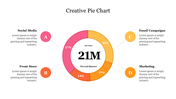
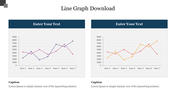
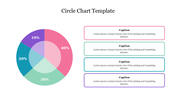
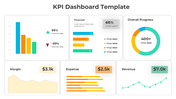
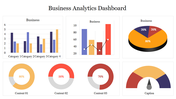
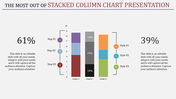
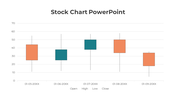
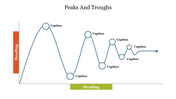
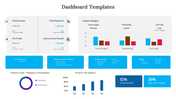
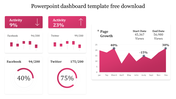
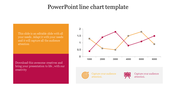
    Chart PowerPoint Templates coupled with business presentation templates, offer a dynamic visual narrative for creative and professional presentations. These templates seamlessly integrate graph design, featuring three nodes that enhance the clarity and impact of information. The strategic use of professional shades and colors adds a sophisticated touch, making the content visually appealing and engaging. Whether employed in creative showcases or business pitches, these templates elevate the overall presentation experience, ensuring a polished and effective delivery of information. Streamlining complex data into visually appealing charts, these templates become invaluable tools for conveying ideas, statistics, and strategies with precision and style.

    Features of the template

    • 100% customizable slides and easy to download.
    • Slides are available in different nodes & colors.
    • The slides contain 16:9 and 4:3 formats.
    • Easy to change the colors quickly.
    • It is a well-crafted template with an instant download facility.
    • Compatible with Google Slides and PowerPoint.
    Advertisement

    You May Also Like These PowerPoint Templates

    Add to Wishlist
    Download
    AI Customize
    A green circular pie chart showing percentage, and four colored sales data graphs for different years.
    Add to Wishlist
    Download
    AI Customize
    A line graph showing a plot structure with key points marked by colored dots, representing key stages.
    Add to Wishlist
    Download
    AI Customize
    SEO marketing plan template with icons representing different elements like e-commerce, email, and global marketing.
    Add to Wishlist
    Download
    AI Customize
    A donut chart with multiple segments in different colors next to a table displaying statistics and percentage changes.
    Free
    Add to Wishlist
    Download
    AI Customize
    Slide deck showcasing KWL chart layouts with colorful sections in purple, yellow, and teal, for structured insights.
    Add to Wishlist
    Download
    AI Customize
    Chart guide slide with two green-tone line graphs displaying data points, captions on the right, and a text footer.
    Free
    Add to Wishlist
    Download
    AI Customize
    Pie chart illustration showcasing five data segments in varying colors with percentage labels and connected captions areas.
    Add to Wishlist
    Download
    AI Customize
    Vertical Microsoft infographic with four colored arrows each labeled with icons for business, target, analytics, and money.
    Add to Wishlist
    Download
    AI Customize
    KPI slide showcasing cash flow metrics and financial performance over six months in different bar chat layouts.
    Free
    Add to Wishlist
    Download
    AI Customize
    Comparison bar chart showing percentage values from 2011 to 2019 for chat and security categories.
    Add to Wishlist
    Download
    AI Customize
    A treasurer’s annual report slide featuring a bar chart and line graph in purple and blue with the title.
    Add to Wishlist
    Download
    AI Customize
    Infographic bar chart slide displaying daily comparisons for Business System and Supplier metrics.
    Add to Wishlist
    Download
    AI Customize
    Amazing Dashboard PowerPoint Template And Google Slides
    Add to Wishlist
    Download
    AI Customize
    Comparison chart with horizontal green bars displaying data for four examples across three series.
    Free
    Add to Wishlist
    Download
    AI Customize
    A slide showing a colorful KWL chart with sections for knowledge, inquiry, and learning outcomes with placeholder text.
    Free
    Add to Wishlist
    Download
    AI Customize
    Pie chart presentation slide showing three charts with percentages with text placeholders.
    Free
    Add to Wishlist
    Download
    AI Customize
    Presentation slide layout illustrating key elements for high quality PowerPoint including steps with icons.
    Add to Wishlist
    Download
    AI Customize
    Color coded Gantt chart slide outlining a yearly project timeline with quarterly milestones and description boxes.
    Add to Wishlist
    Download
    AI Customize
    Circular chart with seven pastel colored segments, each with  icons and captions around it.