Editable charts PowerPoint Presentation Template Designs

Chart guide slide with two green-tone line graphs displaying data points, captions on the right, and a text footer.
P.ID : 5851
    323 views
    25 Downloads
    Get Custom Slides by Experts
    Instantly Access Templates in PowerPoint

    Innovative Charts PowerPoint Slide with Two Sections


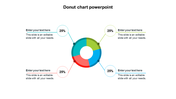
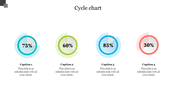
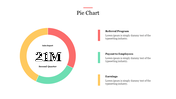
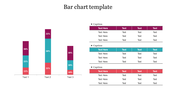
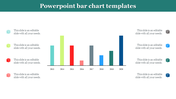
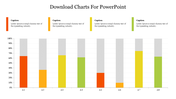
    Download our Charts PowerPoint Template, the go-to solution for professionals, analysts, and educators. This slide, adorned with a captivating green background, serves as the perfect canvas to showcase your data in a way that captivates and informs. If you're aiming for presentations that leave a lasting impression, this template is your secret weapon.

    Tailored for those who demand precision and impact, each caption on the chart comes with its own dedicated text area, providing a seamless blend of aesthetics and information. Whether you're unraveling complex financial data, illustrating performance metrics, or highlighting trends, this template empowers you to tell your story with clarity.

    Why settle for normal when you can elevate your presentations with our template? Download now to embark on a journey of compelling narratives and data visualization mastery. Stand out, communicate effectively, and make every presentation count. Your audience deserves nothing less.

    Features of the template


    • 100% customizable slides are easy to download.
    • Slides are available in different colors.
    • The slide has 4:3 and 16:9 formats.
    • It is easy to change the slide colors quickly.
    • It has a cute design to impress an audience.
    • Create feature-rich, animated presentations.
    Advertisement

    You May Also Like These PowerPoint Templates

    Add to Wishlist
    Download
    AI Customize
    Infographic with four bar graphs, each showing data points A to D, and captions areas in green boxes.
    Add to Wishlist
    Download
    AI Customize
    Dashboard with a bar chart and pie chart in purple shades, comparing project status across regional shares.
    Free
    Add to Wishlist
    Download
    AI Customize
    PowerPoint presentation slide featuring a stacked bar chart, aerial landscape photo, and a comparison table of drone data.
    Free
    Add to Wishlist
    Download
    AI Customize
    PowerPoint slide with a circular pie chart showing four segments labeled with percentages and a placeholder text.
    Add to Wishlist
    Download
    AI Customize
    Customized Kubler Ross PowerPoint Presentation Template
    Add to Wishlist
    Download
    AI Customize
    Visual of boost engagement growth with stacked bar categories: newsletter sign-ups, premium customers, and followers.
    Add to Wishlist
    Download
    AI Customize
    Pie charts showing data percentages for growth, with three percentage values with placeholder text.
    Free
    Add to Wishlist
    Download
    AI Customize
    Chart infographic with four drop shaped gauge style meters in blue, green, yellow, and red, each with text below.
    Add to Wishlist
    Download
    AI Customize
    Dual chart template slide with scatter and bubble charts, the scatter chart on the left and the bubble chart on the right.
    Free
    Add to Wishlist
    Download
    AI Customize
    Slide with green and white sections, featuring pie and bar charts, and an engine image in the bottom right corner.
    Free
    Add to Wishlist
    Download
    AI Customize
    Infographic with a circular segmented chart in blue shades, centered around an AI head graphic placed in white background.
    Add to Wishlist
    Download
    AI Customize
    Executive dashboard presentation slide with arrows and title placeholders on a notebook background.
    Add to Wishlist
    Download
    AI Customize
    PowerPoint pie chart template with three segments and associated icons.
    Add to Wishlist
    Download
    AI Customize
    Three vertical rectangular sections with headers in green, blue, and orange, each with captions inside.
    Add to Wishlist
    Download
    AI Customize
    Colorful pie chart PowerPoint slide with five labeled sections and captions on a white backdrop.
    Free
    Add to Wishlist
    Download
    AI Customize
    Pie chart slide with a blue and dark blue donut chart showing 75% sales, two numbered text boxes on the right.