Best Circle Chart Template PowerPoint Presentation

Colorful circle chart depicting percentage distribution across four categories, with accompanying captions for each segment.
P.ID : 67103
    699 views
    77 Downloads
    Get Custom Slides by Experts
    Instantly Access Templates in PowerPoint

    Best Circle Chart Template PowerPoint Presentation

    Create circular pie presentations with Best Circle Chart Template PowerPoint Presentation. This template relieves your job in presentation-making. It is 100% a user-friendly template. This template holds your time and provides the best presentation-creating experience ever.

    About the template:

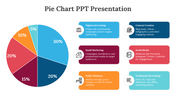
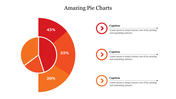
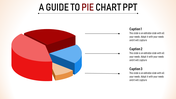
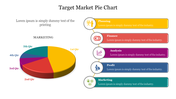
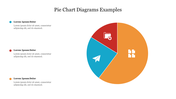
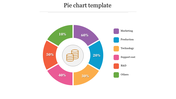
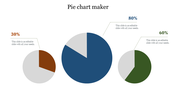
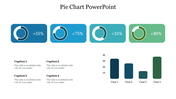
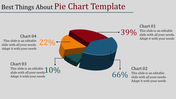
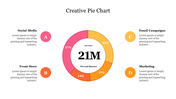
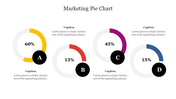
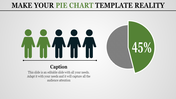
    This Best Circle Chart PowerPoint Template Presentation is one of the charming circular pie templates from SlideEgg. Pie Charts are a perfect tool for expressing percentages or numerical proportions. This template indicates proportional analytics.

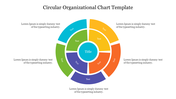
    This is a four nodded template. Each node represents the proportions of the whole value. The nodes are vertically arranged near the circular-chart diagram. Each node has a description space for a brief explanation.

    Use this professionally well-designed template to amaze your audience with a grand ever-lasting impression. Grab now!!!

    Features of this template:

    • 100% customizable slides and easy to download.
    • Slides available in different nodes & colors.
    • The slide contained 16:9 and 4:3 format.
    • Easy to change the slide colors quickly.
    • Well-crafted template with instant download facility.
    • Fantastic four nodded template with vibrant outlook.
    • Unique template with premium features.
    Advertisement

    You May Also Like These PowerPoint Templates

    Add to Wishlist
    Download
    AI Customize
    Analysis report template featuring a purple and green area graph comparing five projects, with separate information
    Add to Wishlist
    Download
    AI Customize
    Area chart with overlapping blue, teal, and green sections, timeline on the axis, and three labeled boxes below.
    Add to Wishlist
    Download
    AI Customize
    A PowerPoint template displaying growth with stages represented by numbered circles showing data for different stages.
    Add to Wishlist
    Download
    AI Customize
    Color coded KWL chart template with sections for What I Know, What I Want to Know, and What I Learned with placeholder text.
    Add to Wishlist
    Download
    AI Customize
    Pie chart slide showcasing six labeled segments in yellow and gray with surrounding icons, on a blue networked background.
    Add to Wishlist
    Download
    AI Customize
    A slide with a line chart slide showing data for Category 1 to 2 over several years with placeholder text.
    Add to Wishlist
    Download
    AI Customize
    Innovative Pie Chart Presentation Example Slide PPT
    Add to Wishlist
    Download
    AI Customize
    Pie chart slide with four numbered pie charts in blue, maroon, orange, and red, each linked to a text box with labels.
    Add to Wishlist
    Download
    AI Customize
    Timeline chart template showing tasks across four years with segmented bars in yellow, red, and purple.
    Add to Wishlist
    Download
    AI Customize
    PowerPoint slide featuring four bar charts with different colors and captions, each representing different data percentages.
    Add to Wishlist
    Download
    AI Customize
    Scatter plot with differently sized bubbles in orange and purple, with a legend and product descriptions to the side.
    Add to Wishlist
    Download
    AI Customize
    Green color KWL chart presentation template with sections for What I Know, What I Want to Know, and What I Learned.
    Add to Wishlist
    Download
    AI Customize
    Yearly loss chart with six green bars and a line graph illustrating trends from 2014 to 2019.
    Add to Wishlist
    Download
    AI Customize
    Mekko chart displaying monthly data in sections, with colors indicating different categories from January to December.
    Add to Wishlist
    Download
    AI Customize
    KWL chart slide with three light gray boxes, featuring maroon headers and side labels for knowledge tracking.