Editable Microsoft Pie Chart Templates For Presentation

Vertical Microsoft infographic with four colored arrows each labeled with icons for business, target, analytics, and money.
P.ID : 65129
    147 views
    13 Downloads
    Get Custom Slides by Experts
    Instantly Access Templates in PowerPoint

    Effective Microsoft Pie Chart PPT PowerPoint Template

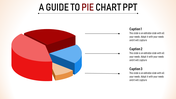
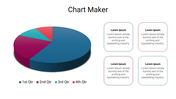
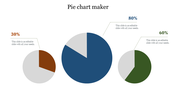
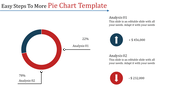
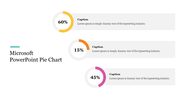
    Do you want to present three plans or ideas in a Pie Chart to an audience? Get our  Pie Chart PowerPoint Slide for a better presentation. For example, you can use this PowerPoint to present your business or sales data in a company plan meeting. If you want to explain your idea in a Pie Chart, use our Pie Chart template. 

    About This Slide:

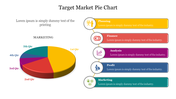
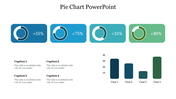
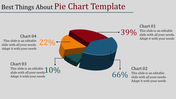
    This Pie Chart Slide contains four text areas with four shades. Users can easily include any data in these text areas. In addition, you can add or modify a text area, font size, and arrows. It is a pre-built Pie Chart design to save time. In addition, We also have a pack of Pie Chart slidesPerfect for presenting your business concept. Easily readable and acceptable template. 

    Features of this template

    • Fully Customizable (shape, color, size & text)
    • This template has a Pie Chart theme.
    • Drag and drop image placeholder
    • Huge Collections of Chart slides to impress your audience
    • This slide further supports the 16:9 and 4:3 format
    Advertisement

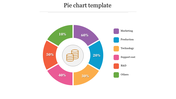
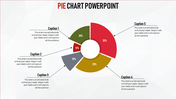
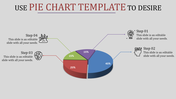
    You May Also Like These PowerPoint Templates

    Add to Wishlist
    Download
    AI Customize
    Two vertical bar charts with three columns each, alongside captions with percentages in varying shades of orange.
    Add to Wishlist
    Download
    AI Customize
    KPI dashboard template with bar and line graphs showing private school growth for 2017, 2018, and 2019 with educational data.
    Free
    Add to Wishlist
    Download
    AI Customize
    Free KPI Presentation PPT Template and Google Slides
    Free
    Add to Wishlist
    Download
    AI Customize
    Revenue analysis slide with bar chart, financial icon, and two descriptive sections for customer metrics.
    Add to Wishlist
    Download
    AI Customize
    3D pie chart with four color-coded segments red, orange, yellow, and brown displaying percentage values.
    Add to Wishlist
    Download
    AI Customize
    PPT template for an annual report featuring a bar graph comparing data across three time periods with color coded categories.
    Free
    Add to Wishlist
    Download
    AI Customize
    Bar chart slide with three stacked bars, each divided into segments with percentage labels, and a table on the right.
    Free
    Add to Wishlist
    Download
    AI Customize
    3D bar graph with six green bars of varying heights, labeled placeholders, and a gray sidebar with text blocks.
    Free
    Add to Wishlist
    Download
    AI Customize
    Slide with four green donut charts and two horizontal bar graphs showing data comparisons across quarters and months.
    Free
    Add to Wishlist
    Download
    AI Customize
    Illustration of six red bars with corresponding percentages and a businesswoman standing beside them.
    Add to Wishlist
    Download
    AI Customize
    Company annual report slide with a gray and red graph displaying data with percentage values for investment and profit.
    Free
    Add to Wishlist
    Download
    AI Customize
    Dashboard template with a circular speedometer gauge in the center, divided into five blue segments labeled 01 to 05.
    Add to Wishlist
    Download
    AI Customize
    Stacked bar chart with four vertical bars showing percentages from 2013, 2014, and 2015 in varying green shades.
    Free
    Add to Wishlist
    Download
    AI Customize
    KPI dashboard bar chart slide representing the height of the world's tallest hills with a world map marking their locations.
    Free
    Add to Wishlist
    Download
    AI Customize
    Dashboard infographic with three gauge meters in blue, green, and yellow, each labeled with a number and caption.
    Add to Wishlist
    Download
    AI Customize
    KPI dashboard slide with line chart, showing performance for four categories, along with circular percentage indicators.
    Add to Wishlist
    Download
    AI Customize
    PPT chart with five colorful percentage indicators displayed in curved circular segments, ranging from 30 to 70 percent.
    Add to Wishlist
    Download
    AI Customize
    Speedometer KPI dashboard showing speed readings for three vehicles a truck, a van, and a car.
    Free
    Add to Wishlist
    Download
    AI Customize
    Visual layout of various charts, including area and bar graphs, arranged in a grid format with caption areas.
    Add to Wishlist
    Download
    AI Customize
    KPI dashboard PowerPoint slide showing a bar chart with active accounts for different categories and percentage indicators.