Easy To Editable KPI PPT And Google Slides Template

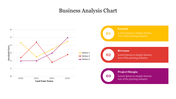
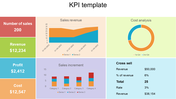
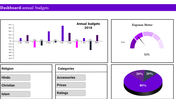
Financial KPI PowerPoint Slide
KPIs, or Key Performance Indicators, are essential metrics that businesses use to evaluate their success in achieving specific objectives. These measurable values provide insights into the effectiveness of various processes, initiatives, or projects within an organization. By tracking KPIs, businesses can assess performance trends, identify areas for improvement, and make informed decisions to drive growth and success. This PowerPoint template offers a comprehensive solution for presenting KPI data effectively. It caters to professionals across industries, including executives, managers, analysts, and consultants, providing them with customizable slides designed specifically for showcasing KPI metrics. With a user-friendly interface and fully editable slide, users can easily input their KPI data, visualize trends, and communicate performance insights with clarity and precision. The template's flexibility allows users to customize colors, fonts, and layouts to match their branding and presentation requirements. Slide is fully editable, empowering presenters to modify content, adjust graphics, and add or remove elements as needed. By utilizing this template, presenters can save time, maintain consistency in visual communication, and effectively convey performance metrics to stakeholders. Encourage your audience to leverage this template to enhance their KPI reporting and analysis, streamline presentation creation processes, and improve communication with stakeholders. Whether it's evaluating financial performance, tracking project milestones, or monitoring sales targets, this template provides the tools needed to create impactful KPI presentations.
Features of this template
- 100% customizable slides and easy to download.
- The slide contains 16:9 and 4:3 formats.
- Easy to change the colors of the slide quickly.
- Highly compatible with PowerPoint and Google Slides.


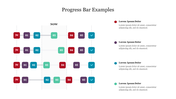
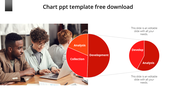
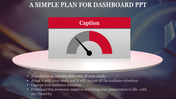
You May Also Like These PowerPoint Templates
Add to Wishlist
Download
AI Customize

Add to Wishlist
Download
AI Customize

Add to Wishlist
Download
AI Customize

Add to Wishlist
Download
AI Customize

Add to Wishlist
Download
AI Customize

Add to Wishlist
Download
AI Customize

Add to Wishlist
Download
AI Customize

Add to Wishlist
Download
AI Customize

Add to Wishlist
Download
AI Customize

Add to Wishlist
Download
AI Customize

Add to Wishlist
Download
AI Customize

Add to Wishlist
Download
AI Customize

Add to Wishlist
Download
AI Customize

Add to Wishlist
Download
AI Customize

Add to Wishlist
Download
AI Customize

Add to Wishlist
Download
AI Customize

Add to Wishlist
Download
AI Customize

Add to Wishlist
Download
AI Customize

Add to Wishlist
Download
AI Customize

Add to Wishlist
Download
AI Customize
