EDITABLE TRACTION POWERPOINT SLIDE TEMPLATE Design

 Canva
Canva
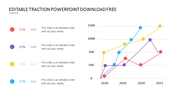
Simple Editable Traction PowerPoint Slide
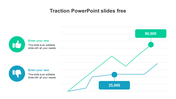
Create traction-related presentations with our Simple Editable Traction PowerPoint Slide. You can encounter the best-ever experience of presentation-making with this traction PPT template. This is a 100% user-friendly template.
It is an eight nodded template. The eight nodes are contrasted with vibrant shades of red, indigo, purple, blue, green, yellow, orange, and pink. They are horizontally arranged at the center of this template. Grab now!!!
Features of the template:
- 100% customizable slides and easy to download.
- Slides are available in different nodes & colors.
- The slide contained 16:9 and 4:3 formats.
- Easy to change the slide colors quickly.
- Well-crafted template with instant download facility.
- Exuberant eight-node featured template.
- Premium template with vibrant outlook.


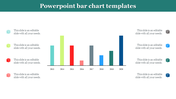
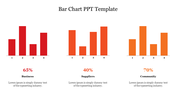
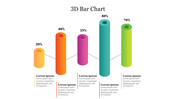
You May Also Like These PowerPoint Templates
Add to Wishlist
Download
Edit


Add to Wishlist
Download
Edit

Add to Wishlist
Download
Edit

Add to Wishlist
Download
Edit

Add to Wishlist
Download
Edit


Add to Wishlist
Download
Edit


Add to Wishlist
Download
Edit

Add to Wishlist
Download
Edit


Add to Wishlist
Download
Edit

Add to Wishlist
Download
Edit


