Effective PowerPoint Chart Templates For Your Presentation

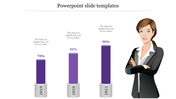
Bar Chart PowerPoint Template
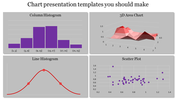
Data need not have to be dull. Our customizable Bar Chart PowerPoint Template is a dynamic tool with a colorful bar chart image to visualize your data based on the comparison, trends and key metrics. Get started now to highlight important business or personal data with our exclusive template.
Benefits of using our template
i) Whether you're planning to share survey data, financial reports, sales data or anything else, our bar chart PPT will help you convey your information effectively with clear data.
ii) Bar charts can be utilized by anyone from business professionals to college students to visually represent your data in a simple format.
iii) Our unique bar chart diagram is crafted to impress your viewers and to help you create an outstanding presentation. You can swap the color shades, font size, and themes to make it look stunning.
iv) Don't let your presentation be dull—make it shine bright with our stunning chart presentation template, all at an affordable price!
Grab it now!
Features of the template:
- 100% customizable slides and easy to download.
- The slides contain 16:9 and 4:3 formats.
- Easy to change the colors quickly.
- It is a 100% pre-designed slide.


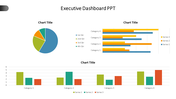
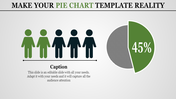
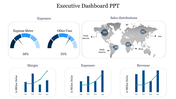
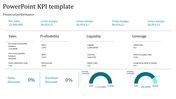
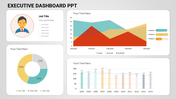
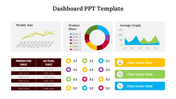
You May Also Like These PowerPoint Templates
Add to Wishlist
Download
AI Customize


Add to Wishlist
Download
AI Customize

Add to Wishlist
Download
AI Customize

Add to Wishlist
Download
AI Customize


Add to Wishlist
Download
AI Customize

Add to Wishlist
Download
AI Customize

Add to Wishlist
Download
AI Customize

Free
Add to Wishlist
Download
AI Customize

Add to Wishlist
Download
AI Customize

Free
Add to Wishlist
Download
AI Customize


Add to Wishlist
Download
AI Customize

Add to Wishlist
Download
AI Customize

Add to Wishlist
Download
AI Customize

Add to Wishlist
Download
AI Customize

Add to Wishlist
Download
AI Customize
