Free - Editable Creative PowerPoint Templates And Google Slides Themes

Free
Creative infographic with a curved orange graph divided into four steps, each with an icon and label.
P.ID : 37716
    145 views
    47 Downloads
    Get Custom Slides by Experts
    Instantly Access Templates in PowerPoint

    Creative Presentation Template Design


    Create presentations that stand out with our Creative PowerPoint Presentation template design, a tool crafted for anyone looking to add a touch of flair to their slides.

    Slide Description:

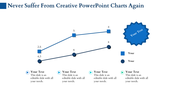
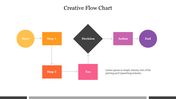
    Our template features a four-step process diagram resembling a mountain peak. Steps labeled with icons as Initiation, Planning, Process, and Execute. Associated business elements: “Business client needs,” “HR,” “Branding,” and “Business card.” 


    Purpose of this slide:

    Visually represents stages of a creative project in a business context. Outlines key areas of focus during project development. Helps convey complex processes in an easy-to-understand format.


    Who can benefit?

    Project managers, marketing teams, and human resources departments. Graphic designers involved in project workflows.


    How can users benefit from this template?

    Enhances communication among team members and stakeholders. Provides clarity on progression from concept to final product delivery.


    Download our templates today!


    Features of the template:


    •  Slides are available in 4:3 & 16:9
    • Well-crafted template with instant download.
    • Get slides that are 100% customizable and easy to download
    Advertisement

    You May Also Like These PowerPoint Templates

    Add to Wishlist
    Download
    AI Customize
    Executive dashboard with four blue horizontal boxes containing text and a smiling cartoon man gesturing on the right.
    Add to Wishlist
    Download
    AI Customize
    Wheel shaped infographic with six labeled stages and captions extending outwards, centered around a handshake symbol.
    Add to Wishlist
    Download
    AI Customize
    Dashboard with a multi-colored semicircular gauge divided into four sections, labeled 01 to 04, and captions on the right.
    Add to Wishlist
    Download
    AI Customize
    Business analysis dashboard with a bar chart and an illustrated man holding a pointer in a dark background.
    Add to Wishlist
    Download
    AI Customize
    PowerPoint Chart Template And Google Slides-Three Node
    Free
    Add to Wishlist
    Download
    AI Customize
    Four cylindrical blue bars in a row next to a woman in a black suit in a simple design layout.
    Add to Wishlist
    Download
    AI Customize
    Market research dashboard with a segmented horizontal bar chart analyzing brand perception and a donut chart.
    Add to Wishlist
    Download
    AI Customize
    Dashboard slide with a speedometer gauge in red, blue, yellow, and teal, and text bullet points on the left.
    Add to Wishlist
    Download
    AI Customize
    Green themed diagram illustrating stages of analysis delivery, from data source to client reports and dashboards.
    Add to Wishlist
    Download
    AI Customize
    A slide showcasing four different chart types from Column Histogram to Scatter Plot with corresponding data.
    Add to Wishlist
    Download
    AI Customize
    Sashboard design featuring three plant species data and corresponding progress meters in red, green, and blue.
    Add to Wishlist
    Download
    AI Customize
    Green circular chart with five segments labeled by categories and percentages, with descriptions around it.
    Add to Wishlist
    Download
    AI Customize
    Chart PPT template showing 4 progress circles with percentages and color coded sections for Blue, Green, Yellow, and Orange.
    Add to Wishlist
    Download
    AI Customize
    Dashboard layout with bar, pie, and stacked charts in yellow, orange, red, and green on a white background.
    Free
    Add to Wishlist
    Download
    AI Customize
    An annual sales template with sections labeled Heading 1 to 5 and a pie chart illustrating various percentages with text.
    Add to Wishlist
    Download
    AI Customize
    Infographic featuring pie graph, horizontal and vertical bar charts for visualizing data trends and comparisons.
    Free
    Add to Wishlist
    Download
    AI Customize
    Illustrative slide combining a pie chart with 45% in green and five silhouette icons to convey data distribution.
    Free
    Add to Wishlist
    Download
    AI Customize
    Vertical bar chart with three purple bars increasing from 2019 to 2021, each labeled with percentages, and a businesswoman.