Pie Chart PowerPoint And Google Slides Templates

Pie chart on the left with four colored sections and percentages, alongside steps with matching colors on the right.
P.ID : 11665
    356 views
    37 Downloads
    Get Custom Slides by Experts
    Instantly Access Templates in PowerPoint

    Pie Chart PowerPoint Slide


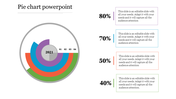
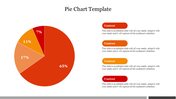
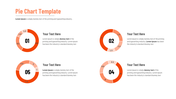
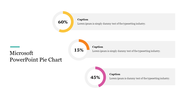
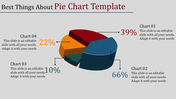
    Reshape your business presentations in a better manner, by introducing our Pie Chart PPT And Google Slides. The slide has a vibrant pie chart with different colors. It helps to represent performance metrics in a business. Beside the chart, four colorful nodes display percentage values. It provides a clear differentiation of performance categories.

    Apt for business professionals, sales managers or project managers showcasing performance metrics. A suitable template for discussing sales performance, revenue distribution or market segmentation. Download now to drag your audience's attention from start to finish. 

    Features of the template

    • The slide contains 16:9 and 4:3 formats.
    • Compatible with Google slide themes and PowerPoint.
    • 100% customizable slides and easy to download.
    • It is easy to change the colors of the slide quickly.
    • Well-crafted template with an instant download facility.
    Advertisement

    You May Also Like These PowerPoint Templates

    Add to Wishlist
    Download
    AI Customize
    Business KPI dashboard showcasing charts for real estate and page views with pie, bar, and line graph visualizations.
    Add to Wishlist
    Download
    AI Customize
    Colorful infographic with a line graph, pie and bar chart, and numerical data panels in a structured KPI template design.
    Add to Wishlist
    Download
    AI Customize
    Dashboard template showing sales, orders, visitors, and users metrics with visual bar and pie charts for website analysis.
    Add to Wishlist
    Download
    AI Customize
    Colorful progress bars in rows, showing numbered squares in red, teal, purple, and blue, with text on the right.
    Add to Wishlist
    Download
    AI Customize
    Professional setting with pie charts showing task distribution in red tones for analysis, collection, and development.
    Add to Wishlist
    Download
    AI Customize
    Slide featuring a blue-toned pie chart representing sales revenue percentages, with captions areas for each segment.
    Add to Wishlist
    Download
    AI Customize
    Row of pie charts with varying color schemes for data visualization each place diwth caption areas.
    Add to Wishlist
    Download
    AI Customize
    Dashboard chart displaying social media subscribers by gender, age, most read articles, and categories in 2019.
    Add to Wishlist
    Download
    AI Customize
    Three pie charts in red, yellow, and blue with percentage values, arranged horizontally with text below.
    Free
    Add to Wishlist
    Download
    AI Customize
    A circular pie chart in blue and orange at the center, flanked by two rectangular sections with icons and text details.
    Add to Wishlist
    Download
    AI Customize
    Chart showing blue bars representing growth metric alongside an orange line marking an ascending trend over eight categories.
    Add to Wishlist
    Download
    AI Customize
    Colorful custom pie chart slide displaying three segments with percentages along with caption placeholders.
    Add to Wishlist
    Download
    AI Customize
    Three circular progress charts in red, teal, and yellow, with percentage levels, displayed on a black rectangular box.
    Add to Wishlist
    Download
    AI Customize
    Cute Pie Chart  Diagram PowerPoint Presentation Template
    Add to Wishlist
    Download
    AI Customize
    Pie chart PPT slide featuring a central chart with labeled sections and additional segmented ring infographics around it.
    Add to Wishlist
    Download
    AI Customize
    Pie chart PPT slide with three segments showing percentages 60 in yellow and two 20 percent segments in red and brown.
    Add to Wishlist
    Download
    AI Customize
    Business infographic showing a pie chart with six sections linked to placeholders featuring icons and text.