Unique Chart Presentation For Your Creative Presentation

Two vertical bar charts with three columns each, alongside captions with percentages in varying shades of orange.
P.ID : 9544
    868 views
    90 Downloads
    Get Custom Slides by Experts
    Instantly Access Templates in PowerPoint

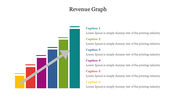
    Transform Your Presentations with Impactful Visuals Dynamic Charts


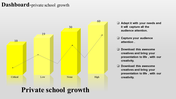
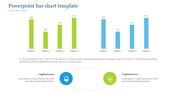
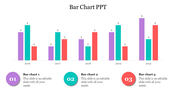
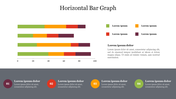
    Experience the power of impactful presentations with our dynamic Chart Presentation template! Crafted to captivate and inform, this template features two sets of three bars bar charts in vibrant orange shades, accompanied by four sleek icons for enhanced clarity. Tailored for business professionals, students, and anyone seeking to elevate their presentations, our template offers versatility and ease of use. Simply plug in your data and let the charts do the talking. Whether you're delivering a sales pitch, academic report, or project update, these templates ensure your audience stays engaged and informed.

    Impress your stakeholders, classmates, or clients with compelling visuals that speak volumes. Elevate your storytelling and make a lasting impression with every slide! Ready to transform your presentations? Download or explore our slides today and unleash the power of captivating charts!

    Features of the template

    • 100% customizable slides and easy to download.
    • Slides are available in different colors
    • The slide has 4:3 and 16:9 formats.
    • Easy to change the slide colors quickly.
    • Appealing Presentation to impress an audience.
    • Create feature-rich slide presentations. 
    • An eye-pleasing color slide helps to give a catchy display.
    • Highly compatible with PowerPoint and Google Slides.
    Advertisement

    You May Also Like These PowerPoint Templates

    Add to Wishlist
    Download
    AI Customize
    A slide displaying a sample bar chart with monthly data from may to december, featuring colorful bars and descriptive text.
    Add to Wishlist
    Download
    AI Customize
    Horizontal chart with four colored bars, each with a color coded icon and caption on the left.
    Add to Wishlist
    Download
    AI Customize
    Bar chart in four distinct bars in multi colour each showing data points with corresponding labels, values and caption areas.
    Add to Wishlist
    Download
    AI Customize
    Chart PowerPoint slide with bar graph and four icons representing data, calendar, and people with placeholder text.
    Add to Wishlist
    Download
    AI Customize
    3D bar graph slide displaying data trends across five years, with color coded bars representing values with placeholder text.
    Add to Wishlist
    Download
    AI Customize
    Colorful bar graph illustrating monthly data with values for each month from january to december.
    Add to Wishlist
    Download
    AI Customize
    Slide with a businessman holding a megaphone projecting speech bubble displaying communication icons, and bar charts below.
    Free
    Add to Wishlist
    Download
    AI Customize
    Three separate bar charts in red tones, each section labeled with a percentage and caption.
    Free
    Add to Wishlist
    Download
    AI Customize
    Technology themed slide with five horizontal purple bars showing percentages, icons, and descriptive captions.
    Add to Wishlist
    Download
    AI Customize
    Three charts with orange bars displayed against dark backgrounds, each labeled with categories and series.
    Add to Wishlist
    Download
    AI Customize
    Progress bar template showing Process A and B side by side, with four stages and completion percentages.
    Add to Wishlist
    Download
    AI Customize
    Presentation slide featuring multicolored bar graphs for categories and a purple and gray pie chart with text sections below.
    Add to Wishlist
    Download
    AI Customize
    Graph with teal and gray bars for project budget, along with expenditure icons and amounts displayed on the right.
    Add to Wishlist
    Download
    AI Customize
    Innovative 3D Progress Bar PowerPoint And Google Slides
    Add to Wishlist
    Download
    AI Customize
    Bar chart with two sections in orange and green, with captions and numerical values under each.
    Add to Wishlist
    Download
    AI Customize
    Data analysis slide with four bar charts in red, green, yellow, and orange, surrounding a dark text box in the center.