Editable KPI Dashboard PowerPoint Template PPT Slide

Dashboard slide showing sales bar chart with a highlighted value and a gauge representing business metrics.
P.ID : 66124
    360 views
    61 Downloads
    Get Custom Slides by Experts
    Instantly Access Templates in PowerPoint

    Editable KPI Dashboard PowerPoint Template PPT Slide

    SlideEgg has come with an editable business use case KPI Dashboard PowerPoint Templates to make an effective presentation. KPI Dashboard PowerPoint Templates are professionally designed templates with suitable graphics and appropriate content. This template is free to edit as deemed fit for your organization.  

    About the template


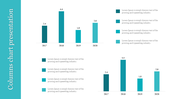
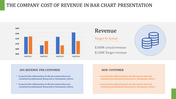
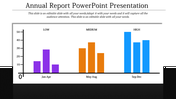
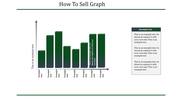
    This colorful bar chart slide shows the Profit and Loss Graphical Representation of collected data from your company. This KPI Dashboard PowerPoint Template PPT can be altered and editable as per your expectations.  Just download it to your system and use it in PowerPoint Slides, depending on your presentation preferences.

    Feature of this Template 

    1.The Slides are available in different nodes & colors.
    2.This slide contains 16:9 and 4:3 formats.
    3.It is easy to change the slide colors quickly.
    4.It is a well-crafted template with an instant download facility 
    5.The best PowerPoint theme template.
    6.It is a well-designed presentation template.
    7.Best KPI Dashboard template for presentations.
    Advertisement

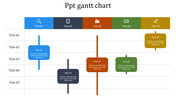
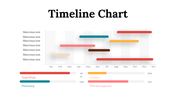
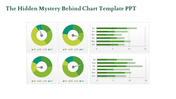
    You May Also Like These PowerPoint Templates

    Free
    Add to Wishlist
    Download
    AI Customize
    Illustration of six red bars with corresponding percentages and a businesswoman standing beside them.
    Free
    Add to Wishlist
    Download
    AI Customize
    Business strategy chart with blue headers for months, showing green bars representing schedules.
    Add to Wishlist
    Download
    AI Customize
    Stacked bar chart with four vertical bars showing percentages from 2013, 2014, and 2015 in varying green shades.
    Free
    Add to Wishlist
    Download
    AI Customize
    Business plan slide showing bar chart comparing impact of society, customer satisfaction, and people satisfaction.
    Add to Wishlist
    Download
    AI Customize
    Color-coded bars representing business growth from 2015 to 2019, with a percentage line graph above showing a rise.
    Add to Wishlist
    Download
    AI Customize
    Project timeline Gantt chart with color coded bars indicating task descriptions, assigned resources, and milestone markers.
    Add to Wishlist
    Download
    AI Customize
    PPT slide displaying various charts including bar charts, pie charts, calendars, and Gantt charts for project tracking.
    Add to Wishlist
    Download
    AI Customize
    PPT chart with five colorful percentage indicators displayed in curved circular segments, ranging from 30 to 70 percent.
    Add to Wishlist
    Download
    AI Customize
    Template showcasing various chart designs, including line, bar, pie, and comparison charts across multiple slides.
    Add to Wishlist
    Download
    AI Customize
    Creative charts showing a circular 60% approval metric, bar graphs, and a 55% Twitter engagement donut chart.
    Free
    Add to Wishlist
    Download
    AI Customize
    PPT slide with a yellow bar chart showing percentages for the years 2016 to 2021 with a woman standing next to the chart.
    Free
    Add to Wishlist
    Download
    AI Customize
    Gantt chart plan template showing tasks across months with a colorful circular pie chart and matching bars on theright.
    Free
    Add to Wishlist
    Download
    AI Customize
    Bar chart comparing metrics over years alongside a diagram linking manager, idea, and management to business growth.
    Add to Wishlist
    Download
    AI Customize
    Project schedule slide with a Gantt chart displaying tasks, timelines, and completion percentages.
    Free
    Add to Wishlist
    Download
    AI Customize
    Comparison of revenue and cost distributions with pie charts displaying CAPEX and OPEX percentages.
    Free
    Add to Wishlist
    Download
    AI Customize
    Horizontal Gantt chart showing tasks by days with segments in blue, purple, and black, indicating task progress and status.
    Add to Wishlist
    Download
    AI Customize
    Funnel infographic with blue, red, yellow, and green sections, each with icons, connected to text descriptions.
    Free
    Add to Wishlist
    Download
    AI Customize
    Four vertical orange columns and percentages, labeled by year, along with a businesswoman illustration on the right.
    Free
    Add to Wishlist
    Download
    AI Customize
    3D green pie chart infographic divided into four steps of varying heights, with numbered labels and descriptions around it.