Clustered Column chart PowerPoint Presentation Template

Presentation slide featuring multicolored bar graphs for categories and a purple and gray pie chart with text sections below.
P.ID : 34761
    181 views
    17 Downloads
    Get Custom Slides by Experts
    Instantly Access Templates in PowerPoint

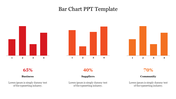
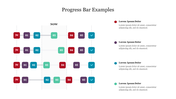
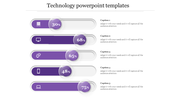
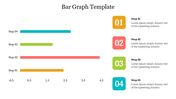
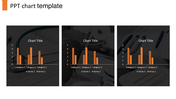
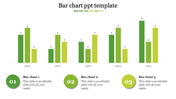
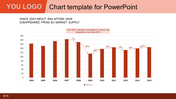
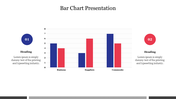
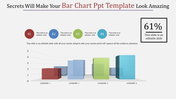
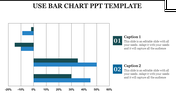
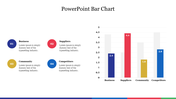
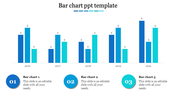
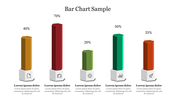
    Chart PPT Templates and Google Slides


    Elevate your presentations with our expertly crafted chart PowerPoint presentation templates. Designed for the modern professional, our templates feature stunning pie chart PowerPoint templates that seamlessly integrate four nodes, providing a clear, concise, and visually appealing way to represent data. Each template uses multiple shades of colors, ensuring your slides are both professional and engaging. Whether you’re showcasing market analysis, financial statistics, or project progress, our pie charts add a touch of creativity and clarity to your business presentations.

    Our graph designs are tailored to make your data stand out. The use of multiple shades helps differentiate segments clearly, making it easier for your audience to grasp complex information at a glance. Perfect for any business setting, these templates can transform mundane numbers into captivating stories. Impress your colleagues and stakeholders with presentations that are not only informative but also visually compelling, ensuring your key points are highlighted and remembered. Choose our chart PowerPoint presentation templates for a creative, polished, and impactful presentation experience.

    Features of this template

    • 100% customizable slides and easy to download.
    • The slide contains 16:9 and 4:3 formats.
    • Easy to change the colors of the slide quickly.
    • Highly compatible with PowerPoint and Google Slides.
    Advertisement

    You May Also Like These PowerPoint Templates

    Add to Wishlist
    Download
    AI Customize
    Graph with teal and gray bars for project budget, along with expenditure icons and amounts displayed on the right.
    Add to Wishlist
    Download
    AI Customize
    Innovative 3D Progress Bar PowerPoint And Google Slides
    Add to Wishlist
    Download
    AI Customize
    Editable PowerPoint Chart Templates For Presentation
    Add to Wishlist
    Download
    AI Customize
    PowerPoint slide with a bar chart showing data for 2017, 2018, 2019, and 2020 in colorful bars.
    Add to Wishlist
    Download
    AI Customize
    PowerPoint chart template showing stacked bar graphs with different categories and values for each year from 2016 to 2019.
    Add to Wishlist
    Download
    AI Customize
    Bar chart with two sections in orange and green, with captions and numerical values under each.
    Add to Wishlist
    Download
    AI Customize
    Bar chart slide showcasing yearly data from 2016 to 2021, with three distinct bar categories and values in shades of purple.
    Add to Wishlist
    Download
    AI Customize
    Slide featuring a 3D bar graph with three series on dark backdrop, a green star shaped badge, and text boxes below.
    Add to Wishlist
    Download
    AI Customize
    Data analysis slide with four bar charts in red, green, yellow, and orange, surrounding a dark text box in the center.
    Add to Wishlist
    Download
    AI Customize
    PowerPoint bar chart design slide featuring various colored flags and labeled categories at the bottom.
    Add to Wishlist
    Download
    AI Customize
    Simple Bar Chart Layout PowerPoint Presentation
    Add to Wishlist
    Download
    AI Customize
    Bar chart slide design with stacked bars showing three categories per item and percentage captions on the left.
    Add to Wishlist
    Download
    AI Customize
    PowerPoint template with two bar charts, one green, and one blue, representing four categories.
    Add to Wishlist
    Download
    AI Customize
    Colorful bar chart PPT template displaying four sections with data values and corresponding captions for 2018 to 2021.
    Free
    Add to Wishlist
    Download
    AI Customize
    PowerPoint slide with a bar chart showcasing three data series for different examples.
    Add to Wishlist
    Download
    AI Customize
    Chart layout with stacked bar graphs in red, yellow, green, and teal representing A1 to A8, with captions above.
    Free
    Add to Wishlist
    Download
    AI Customize
    Red themed template with four circular percentage indicators over rounded bars, aligned with icons and captions.