Practical Charts PowerPoint Template And Google Slides

Creative PowerPoint slide with two lines on a chart yellow and red with a green dot marking the highest point on the line.
P.ID : 4267
    408 views
    44 Downloads
    Get Custom Slides by Experts
    Instantly Access Templates in PowerPoint

    Creative Chart PowerPoint Template with Two Nodes


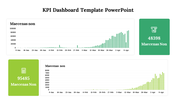
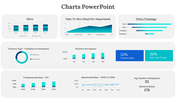
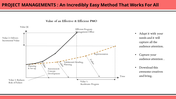
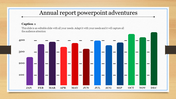
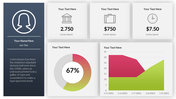
    Embark on a journey of visual storytelling with our Creative Charts PowerPoint Template, meticulously crafted for analysts, financial professionals, and presenters seeking to transform data into impactful narratives. The slide features a dynamic chart with two lines: one representing dollar values on the vertical axis and the other illustrating years on the horizontal axis.

    Ideal for financial presentations, trend analysis, or performance reviews, this template ensures your data is presented with clarity and creativity. The intuitive design allows for a seamless understanding of the correlation between financial values and time.

    Ready to elevate your data presentations? Click now to access the Creative Charts PowerPoint Template, where creativity meets precision. Propel your presentations, engage your audience, and convey your data with confidence. Your journey to impactful chart presentations starts here!

    Features of the template


    • 100% customizable slides are easy to download.
    • Slides are available in different colors.
    • The slide has 4:3 and 16:9 formats.
    • It is easy to change the slide colors quickly.
    • It has a cute design to impress an audience.
    • Create feature-rich, animated presentations.
    Advertisement

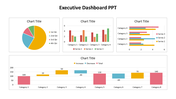
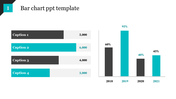
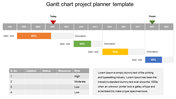
    You May Also Like These PowerPoint Templates

    Add to Wishlist
    Download
    AI Customize
    A colorful dashboard PowerPoint slide featuring graphs, stats, and a pie chart for a data driven presentation with captions.
    Add to Wishlist
    Download
    AI Customize
    Dashboard PowerPoint slide featuring three speedometer style gauges displaying percentages with a dartboard graphic.
    Add to Wishlist
    Download
    AI Customize
    Dashboard with charts and metrics, including pie chart for sales, bar and line charts, and visitor statistics.
    Free
    Add to Wishlist
    Download
    AI Customize
    Line chart with data points marked by blue squares and black dots, displaying values from 2006 to 2014.
    Add to Wishlist
    Download
    AI Customize
    Dashboard slide displaying upcoming deposits, transactions, market location, and financial data on a dark backdrop.
    Add to Wishlist
    Download
    AI Customize
    Executive dashboard PowerPoint slide featuring line and bar charts, pie charts, and world map markers for data analysis.
    Add to Wishlist
    Download
    AI Customize
    Gantt chart with colorful horizontal bars spanning from January to June, representing project timelines and milestones.
    Free
    Add to Wishlist
    Download
    AI Customize
    PowerPoint slide with a bar chart showcasing three data series for different examples.
    Add to Wishlist
    Download
    AI Customize
    Dashboard themed PowerPoint slide with six gauges and captions for content.
    Add to Wishlist
    Download
    AI Customize
    Chart layout with stacked bar graphs in red, yellow, green, and teal representing A1 to A8, with captions above.
    Add to Wishlist
    Download
    AI Customize
    Infographic template with bar, pie, and world map charts for PowerPoint presentations in shades of red and orange.
    Add to Wishlist
    Download
    AI Customize
    KPI dashboard with a mix of bar, pie, and line charts highlighting revenue, sales, and customer buying patterns.
    Add to Wishlist
    Download
    AI Customize
    Dashboard PPT template with three colored gauges showing 30, 60, and 90 percent completion with captions.
    Add to Wishlist
    Download
    AI Customize
    Slide showing a bar chart with values for 2017, 2018, 2019, and 2020, with each year represented in different shades of blue.
    Add to Wishlist
    Download
    AI Customize
    Matrix chart with skill and will axes, divided into quadrants labeled high and low, with numbered circles and icons.
    Add to Wishlist
    Download
    AI Customize
    PowerPoint chart template displaying three donut charts with percentages and icons representing data categories.
    Add to Wishlist
    Download
    AI Customize
    Project plan Gantt chart template displaying tasks with milestones and progress percentages across months from Jan to Dec.