Find the Best Dashboard PPT and Google Slides Presentation

A PowerPoint slide with a circular dashboard chart showing progress levels from low to high with captions.
P.ID : 17481
    804 views
    75 Downloads
    Get Custom Slides by Experts
    Instantly Access Templates in PowerPoint

    Dashboard Presentation Template


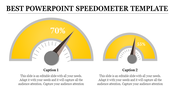
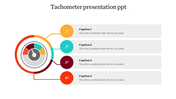
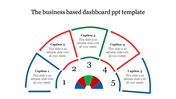
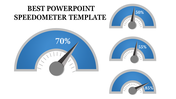
    Accelerate your presentations to new heights with our Dashboard Presentation Template. The slide comes with a white backdrop. A dynamic speedometer steals the spotlight. It visually represents data variations from low to high speed. This eye catching metaphor helps the user to grasp the intensity and magnitude of your information. Numeric indicators provide precise speed values. 

    It offers a comprehensive view of your data metrics. Two strategically placed sets of captions allow you to tailor the content. Perfect for data analysts, business executives and anyone seeking to revamp their presentations. Download today to steer your presentations towards impactful insights.

    Features of the template

    • The slide contains 16:9 and 4:3 formats.
    • Compatible with Google Slides Themes and PowerPoint.
    • 100% customizable slides and easy to download.
    • It is easy to change the colors of the slide quickly.
    • Well-crafted template with an instant download facility.
    Advertisement

    You May Also Like These PowerPoint Templates

    Add to Wishlist
    Download
    AI Customize
    Infographic featuring two red semicircular speedometers with needles, displaying percentages, and captions below.
    Add to Wishlist
    Download
    AI Customize
    Chart slide featuring a weekly schedule with multiple rows and columns with placeholder text gradient blue and green bars.
    Add to Wishlist
    Download
    AI Customize
    Editable PowerPoint Chart Templates For Presentation
    Add to Wishlist
    Download
    AI Customize
    Infographic with bar charts, percentage stats, and a layered blue 3D smartphone like structure with four captions.
    Free
    Add to Wishlist
    Download
    AI Customize
    Line chart with green and yellow lines showing three data series, text placeholders and a starburst badge.
    Add to Wishlist
    Download
    AI Customize
    Purple themed dashboard slide featuring multiple charts and a text box for descriptive content.
    Add to Wishlist
    Download
    AI Customize
    Slide featuring two line graphs and bar charts in green, comparing data across months and quarters.
    Add to Wishlist
    Download
    AI Customize
    Innovative Pie Chart PowerPoint Template Presentation
    Add to Wishlist
    Download
    AI Customize
    PowerPoint slide with a bar chart showing data for 2017, 2018, 2019, and 2020 in colorful bars.
    Add to Wishlist
    Download
    AI Customize
    Dashboard slide with three blue icons and captions paired with a bar chart on a tablet screen, and a desk setup on the right.
    Add to Wishlist
    Download
    AI Customize
    Yellow speedometer graphic indicating 70%, with a gray needle pointing right and a caption area below.
    Add to Wishlist
    Download
    AI Customize
    Slide with a three part 3D pie chart, featuring a highlighted red segment, on a beige background.
    Add to Wishlist
    Download
    AI Customize
    Black circular speedometer gauge with a green needle, surrounded by six captions on a white background.
    Free
    Add to Wishlist
    Download
    AI Customize
    Circular speedometer infographic with a black needle, yellow progress arc, and distance markers, next to an text box.
    Add to Wishlist
    Download
    AI Customize
    Sales performance dashboard PowerPoint template with a line graph, pie chart, and percentage change analysis.