Try our Predesigned Chart Template PPT Presentation

Slide featuring two line graphs and bar charts in green, comparing data across months and quarters.
P.ID : 4173
    264 views
    16 Downloads
    Get Custom Slides by Experts
    Instantly Access Templates in PowerPoint

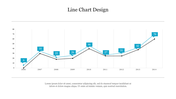
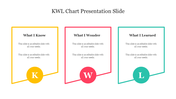
    A Predesigned Chart Presentation Slide


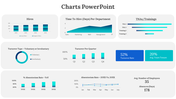
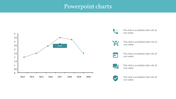
    Are you looking to make your data presentations more effective and engaging? Look no further than our Chart PowerPoint Template! This dynamic slide combines style and substance to help you communicate complex data clearly and concisely.

    A standout feature of this template is a unique slide that merges the elegance of a line chart with the robustness of a bar chart. This allows you to showcase trends over time while emphasizing key data points. With intuitive customization options, you can easily design this slide to fit your data and create a visual narrative that resonates with your audience.
    Whether you're a business professional, analyst, or educator, this versatile slide is a game-changer for simplifying data communication. Use it to present financial trends, project timelines, market analysis, and more. With this template, you can convey complex ideas with ease and make data-driven decisions a visual feast.

    Ready to transform your data into a compelling story? Download our Chart PowerPoint Template today and start charting your success!

    Features of the Templates


    •  Completely adaptable.
    •  The slide show is in 4:3, 16:9, zip format.
    •  There is very strong connectivity with Google Slides and PowerPoint.
    •  It is simple and quick to alter the slide's color.
    •  An efficient template that can be easily accessed immediately.
    •  Easy to Download.
    Advertisement

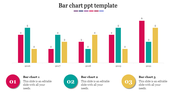
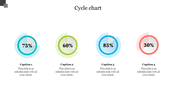
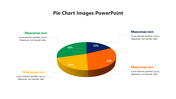
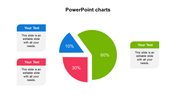
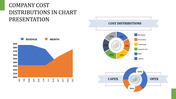
    You May Also Like These PowerPoint Templates

    Add to Wishlist
    Download
    AI Customize
    Slide with a horizontal bar chart on the left and 3D cylindrical percentage charts in blue, green, and teal, on the right.
    Add to Wishlist
    Download
    AI Customize
    Horizontal bar chart with four labeld sections A to D, in purple, pink, teal, and blue, and captions below.
    Add to Wishlist
    Download
    AI Customize
    Business chart slide with a red and black line graph on the left, a red bar chart on the right, and two description sections.
    Add to Wishlist
    Download
    AI Customize
    Best Waterfall In PowerPoint Presentation Slide Designs
    Free
    Add to Wishlist
    Download
    AI Customize
    Layered area chart with Series 1 in yellow, Series 2 in orange, and Series 3 in black, showing data trends over time.
    Add to Wishlist
    Download
    AI Customize
    Clustered bar chart comparing data across quarters with horizontal bars in various colors.
    Add to Wishlist
    Download
    AI Customize
    Slide with three vertical boxes in blue, red, and green banners, and rounded icons labeled K, W, and L for learning stages.
    Add to Wishlist
    Download
    AI Customize
    PowerPoint chart template showing stacked bar graphs with different categories and values for each year from 2016 to 2019.
    Add to Wishlist
    Download
    AI Customize
    Line graph infographic showing data from 2015 to 2020, with three colored lines in purple, yellow, and green, and text.
    Add to Wishlist
    Download
    AI Customize
    Donut chart in blue and orange displaying percentage, with matching colored caption boxes on either side.
    Add to Wishlist
    Download
    AI Customize
    Our Predesigned Chart Templates PPT Slides Designs
    Add to Wishlist
    Download
    AI Customize
    KWL chart slide with three columns in blue, red, and gold, representing learning insights.
    Add to Wishlist
    Download
    AI Customize
    Infographic with four bar graphs, each showing data points A to D, and captions areas in green boxes.
    Free
    Add to Wishlist
    Download
    AI Customize
    PowerPoint presentation slide featuring a stacked bar chart, aerial landscape photo, and a comparison table of drone data.
    Add to Wishlist
    Download
    AI Customize
    Customized Kubler Ross PowerPoint Presentation Template
    Add to Wishlist
    Download
    AI Customize
    Visual of boost engagement growth with stacked bar categories: newsletter sign-ups, premium customers, and followers.
    Add to Wishlist
    Download
    AI Customize
    Pie charts showing data percentages for growth, with three percentage values with placeholder text.