Attractive Dashboard PPT Template Designs - Four Node


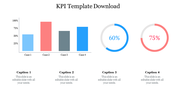
Practical Dashboard PowerPoint Template
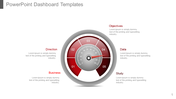
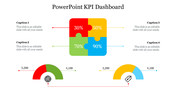
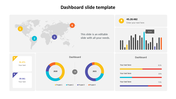
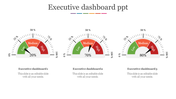
Experience the power of precision with our dashboard PPT template. Analysts, executives, and professionals can use this slide to make an impactful data visualization. This template boasts four sleek speedometers, each precisely reflecting percentage levels.
Strategically designed text areas accompany each speedometer, providing a seamless integration space for your key data points. Whether you're presenting financial metrics, project progress, or performance indicators, this template ensures your information is conveyed with clarity and sophistication.
Ideal for anyone looking to enhance their data presentations, click now to access the dashboard template, where precision meets visual appeal. Propel your presentations, engage your audience, and showcase your data with confidence. Your journey to impactful data presentations starts here!
Features of the template
- 100% customizable slides are easy to download.
- Slides are available in different colors.
- The slide has 4:3 and 16:9 formats.
- It is easy to change the slide colors quickly.
- It has a cute design to impress an audience.
- Create feature-rich, animated presentations.


You May Also Like These PowerPoint Templates
Add to Wishlist
Download
Edit

Add to Wishlist
Download
Edit

Add to Wishlist
Download
Edit

Add to Wishlist
Download
Edit


Add to Wishlist
Download
Edit

Add to Wishlist
Download
Edit

Add to Wishlist
Download
Edit

Add to Wishlist
Download
Edit

Add to Wishlist
Download
Edit


Add to Wishlist
Download
Edit


Add to Wishlist
Download
Edit

Add to Wishlist
Download
Edit


Add to Wishlist
Download
Edit

Add to Wishlist
Download
Edit

Add to Wishlist
Download
Edit

Add to Wishlist
Download
Edit
