Attractive Executive Dashboard PPT And Google Slides


Best Executive Dashboard PowerPoint Template
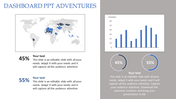
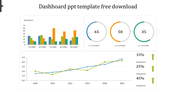
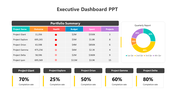
Our best Executive Dashboard PowerPoint presentation is a straightforward yet powerful tool for monitoring key performance indicators (KPIs) in the electricity sector. With an editable slide design featuring an eye-catching area chart distinguishing between shine temperature and ankle temperature, Executives, managers, and decision-makers use executive dashboards for real-time insights into business performance metrics. this presentation enables you to customize content to your specific needs effortlessly.
Download the "Executive Dashboard" PowerPoint presentation now and empower your team with actionable insights for enhanced efficiency and informed decision-making in the electricity sector.
Features of this template
- 100% customizable slides and easy to download.
- The slide contains 16:9 and 4:3 formats.
- Easy to change the colors of the slide quickly.
- Highly compatible with PowerPoint and Google Slides.


You May Also Like These PowerPoint Templates
Add to Wishlist
Download
Edit


Add to Wishlist
Download
Edit


Add to Wishlist
Download
Edit

Add to Wishlist
Download
Edit

Add to Wishlist
Download
Edit

Add to Wishlist
Download
Edit


Add to Wishlist
Download

Add to Wishlist
Download
Edit


Add to Wishlist
Download
Edit

Add to Wishlist
Download
Edit

Add to Wishlist
Download
Edit


Showing20 of69,218 templates