Business Model KPI Dashboard Template Presentation

Internet speed dashboard featuring two routers with speed performance indicators and mobile phones.
P.ID : 1899
    669 views
    26 Downloads
    Get Custom Slides by Experts
    Instantly Access Templates in PowerPoint

    KPI Dashboard Template for YouTube


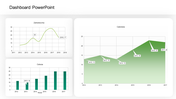
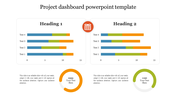
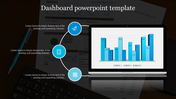
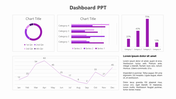
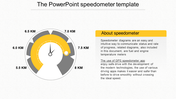
    Introducing our game-changing "KPI Dashboard" PowerPoint presentation designed specifically for digital marketers navigating the dynamic landscape of YouTube analytics. With a visually stunning design featuring two columns measuring internet connection speeds—ABC and Xin—this editable slide offers invaluable insights into loading, downloading, and uploading speeds. Designed for digital marketers, this dashboard serves as a powerful tool for optimizing YouTube content strategies. Explore deep into audience engagement metrics, refine upload schedules, and enhance video quality with precision. Empowering digital marketers to make data-driven decisions, this dashboard enables strategic alignment with campaign objectives and audience preferences. Stay ahead of the competition and maximize your YouTube performance with our KPI Dashboard Template. Download now and unlock the potential of actionable insights for unparalleled marketing success.

    Features of the Template


    • 100 % customizable slides.
    • The slide show is in 4:3, 16:9, zip format.
    • There is powerful connectivity with Google Slides and PowerPoint.
    • It is simple and quick to alter the slide's color.
    • An efficient template that can be easily accessed immediately.
    • Well-crafted template with an instant download facility.
    Advertisement

    You May Also Like These PowerPoint Templates

    Add to Wishlist
    Download
    AI Customize
    Chart design slide tracking article likes, comments, shares, total posts, and new subscriber growth with visual graphs.
    Add to Wishlist
    Download
    AI Customize
    Speedometer PowerPoint template with yellow background showing a 70 percent reading, along with 50 and 60 percent gauges.
    Add to Wishlist
    Download
    AI Customize
    Executive dashboard featuring a bar chart of project tasks, pie chart for project distribution, and a line graph.
    Free
    Add to Wishlist
    Download
    AI Customize
    Speedometer graphic with a blue progress bar, labeled distance values, and a right-side text box explaining its concept.
    Add to Wishlist
    Download
    AI Customize
    Chart PPT template with bar graphs showing clicks and recipients, a pie chart for email categories, and a line graph.
    Add to Wishlist
    Download
    AI Customize
    Dashboard layout with horizontal bar charts and circular progress indicators in green, yellow, orange, and blue.
    Add to Wishlist
    Download
    AI Customize
    Amazing PowerPoint Dashboard Presentation Template
    Add to Wishlist
    Download
    AI Customize
    Circular tachometer gauge with a needle pointing six colored sections, and captions in rounded rectangles connected by lines.
    Free
    Add to Wishlist
    Download
    AI Customize
    Circular gauge style infographic in shades of gray, showing a speedometer with a needle and distance markers.
    Add to Wishlist
    Download
    AI Customize
    Business executive dashboard template displaying project information, including date and editor with placeholder text.
    Add to Wishlist
    Download
    AI Customize
    A tachometer PowerPoint template with five dials in different colors, each representing a specific section with captions.
    Add to Wishlist
    Download
    AI Customize
    Dashboard themed slide with a semi circular gauge showing four icons for speedometers and a central needle pointer.
    Add to Wishlist
    Download
    AI Customize
    Dashboard layout with gauges, bar charts, line graphs, and progress indicators for business performance metrics.
    Add to Wishlist
    Download
    AI Customize
    Business dashboard with expense bar chart, executive distribution, sales pie chart, and revenue gauge.
    Add to Wishlist
    Download
    AI Customize
    Green speedometer graphics illustrating performance levels at 70, 50, 55, and 85 percent in a PowerPoint template.
    Add to Wishlist
    Download
    AI Customize
    Chart template featuring bar, line, and calendar charts with editable placeholders for Q1, Q2, and monthly data.