Get Chart Presentation Template and Google Slides Themes

Chart design slide tracking article likes, comments, shares, total posts, and new subscriber growth with visual graphs.
P.ID : 34137
    289 views
    9 Downloads
    Get Custom Slides by Experts
    Instantly Access Templates in PowerPoint

    Visualize Data Effectively with Chart Presentation Template


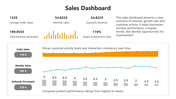
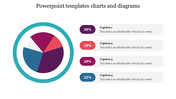
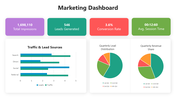
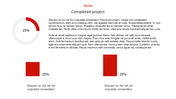
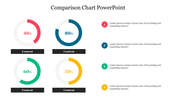
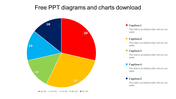
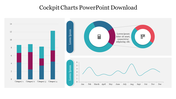
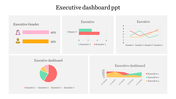
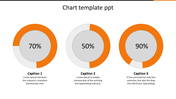
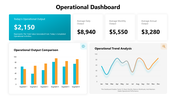
    Charts are powerful tools for visualizing data, enabling viewers to grasp complex information quickly and efficiently. Our Chart Presentation Template and Google Slides Themes offer a diverse collection of four types of charts and graphs, each boasting a unique color theme and accompanied by customizable text areas.

    Ideal for anyone across industries, including finance, marketing, and analytics. This template empowers users to create compelling presentations that communicate data insights, trends, and analysis. Whether illustrating sales performance, market trends, or project timelines, our template ensures clarity and impact in every presentation.

    Features of the template


    • 100% customizable slides are easy to download.
    • Slides are available in different colors.
    • The slide has 4:3 and 16:9 formats.
    • It is easy to change the slide colors quickly.
    • It has a cute design to impress an audience.
    • Create feature-rich, animated presentations.
    Advertisement

    You May Also Like These PowerPoint Templates

    Add to Wishlist
    Download
    AI Customize
    Wheel shaped infographic with six labeled stages and captions extending outwards, centered around a handshake symbol.
    Add to Wishlist
    Download
    AI Customize
    Executive dashboard with four blue horizontal boxes containing text and a smiling cartoon man gesturing on the right.
    Add to Wishlist
    Download
    AI Customize
    Dashboard with a multi-colored semicircular gauge divided into four sections, labeled 01 to 04, and captions on the right.
    Add to Wishlist
    Download
    AI Customize
    Dashboard layout with charts, graphs, and a world map in vibrant colors, showcasing data visually.
    Add to Wishlist
    Download
    AI Customize
    Circular gauge template with sections in red, orange, yellow, green, and dark green, with captions on either side.
    Add to Wishlist
    Download
    AI Customize
    Infographic dashboard featuring a world map with COVID-19 case data, a gender-based death rate chart, and a pie chart.
    Add to Wishlist
    Download
    AI Customize
    PowerPoint slide for executive dashboard featuring four icons target, speed, error reduction, and growth with text area.
    Add to Wishlist
    Download
    AI Customize
    KPI dashboard template PowerPoint slide featuring three sections for data visualization.
    Add to Wishlist
    Download
    AI Customize
    Dashboard layout including a bar chart of company data, a pie chart for quarterly sales distribution.
    Free
    Add to Wishlist
    Download
    AI Customize
    Pie chart in orange, red, green, and blue sections with two text labels on either side, highlighting sales performance.
    Add to Wishlist
    Download
    AI Customize
    Attractive PowerPoint KPI Dashboard Presentation Template
    Add to Wishlist
    Download
    AI Customize
    Dashboard gauge chart PPT template with color coded sections for big loss, loss, break even, profit, and high profit.
    Add to Wishlist
    Download
    AI Customize
    Internet speed dashboard featuring two routers with speed performance indicators and mobile phones.
    Free
    Add to Wishlist
    Download
    AI Customize
    Green radial gauge with a modern layout, surrounded by five labeled rectangular sections on a neutral background.
    Add to Wishlist
    Download
    AI Customize
    Colorful dashboard PPT slide with world map, pie charts, bar graphs, and metrics with placeholder text.
    Free
    Add to Wishlist
    Download
    AI Customize
    Dashboard template with three colorful gauge icons in the center and text boxes in green, blue, and gold.