Great Tachometer Presentation Download PPT Templates

A tachometer PowerPoint template with five dials in different colors, each representing a specific section with captions.
P.ID : 48947
    197 views
    16 Downloads
    Get Custom Slides by Experts
    Instantly Access Templates in PowerPoint

    Tremendous Tachometer Template

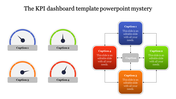
    Find this various tachometer animation inserted template representing various speeds and their values. The five animations differ in colors and in the speed value with one another to help you build up your points. The node space is given below, and above, the animations are placed on relating your points around it. The curved line, like a border, connects all your nodes and animations. The attractive colors added to the circular animation will brighten up your presentation. Many attributes are loaded here, so witness it by downloading this craft from us.


    Features of the template

    • 100% customizable slides and easy to download
    • Slides are available. Vacation Themed Template
    • The slides contained 16:9 and 4:3 formats.
    • Easy to change the slide colors quickly.
    • Well-crafted template with instant download facility.
    • One of the best templates from SlideEgg.
    • Engaging animations are inserted.
    Advertisement

    You May Also Like These PowerPoint Templates

    Add to Wishlist
    Download
    AI Customize
    Dashboard slide showing business performance, including technology, accessibility, and security scores with activity graphs.
    Add to Wishlist
    Download
    AI Customize
    KPI dashboard slide featuring six charts vertical bars, horizontal bars, area graph, pie chart, and column bar graphs.
    Add to Wishlist
    Download
    AI Customize
    KPI dashboard highlighting supplier statistics using donut charts, order-to-invoice process, and bar charts.
    Free
    Add to Wishlist
    Download
    AI Customize
    Dashboard with four sections showing charts, icons, and metrics in purple, red, green, and teal.
    Free
    Add to Wishlist
    Download
    AI Customize
    A slide with a sleek dashboard design that includes colorful data visualizations like pie charts, graphs, and progress bars.
    Free
    Add to Wishlist
    Download
    AI Customize
    KPI dashboard with percentage stats, bar charts, and flow diagrams in red, blue, and orange representing data trends.
    Add to Wishlist
    Download
    AI Customize
    KPI dashboard slide displaying supplier metrics with colorful pie charts, bar graphs, and a process flow with percentages.
    Free
    Add to Wishlist
    Download
    AI Customize
    KPI slide displaying three circular meters with red, green, and orange sections, with text descriptions on the right.
    Free
    Add to Wishlist
    Download
    AI Customize
     KPI dashboard featuring colorful graphs, sales metrics, real estate charts, and visitor statistics, in a grid layout.
    Free
    Add to Wishlist
    Download
    AI Customize
    Slide with multiple dashboard elements including bar charts, line charts, pie charts, and progress meters in various colors.
    Free
    Add to Wishlist
    Download
    AI Customize
    KPI PowerPoint slide with line, bar, pie, and horizontal bar charts, each showing different business data metrics.
    Add to Wishlist
    Download
    AI Customize
    Executive summary dashboard featuring contract metrics, costs vs. revenue, and breakdowns by status, industry, and category.
    Free
    Add to Wishlist
    Download
    AI Customize
    Free Dashboard Templates For PowerPoint & Google Slides
    Add to Wishlist
    Download
    AI Customize
    Dashboard slide displaying data through colorful bar charts, a pie chart, and a project timeline with phase completions.
    Free
    Add to Wishlist
    Download
    AI Customize
    Semi circular speedometer graphic with red to yellow gradient, and three placeholder text below.
    Add to Wishlist
    Download
    AI Customize
    RAG status slide with a task table featuring colored status indicators and four charts, including pie and line graphs.
    Add to Wishlist
    Download
    AI Customize
    Comprehensive KPI dashboard slide with performance indicators visualized through charts and graphs for business tracking.