Free - Free KPI PPT Template for Google Slides presentaion
Free

Free KPI Presentation Template For Your Business
Download this KPI PPT Template Free to make an informative business presentation. It will help you to get your point across in a highly effective manner. This free slide provides all of the necessary visual cues you need to make a professional-looking KPI presentation without having to pay even a single penny. In addition, it will help you keep everyone up-to-date about your company's statistics, allowing you to present them in an engaging manner that will not only make them understand but they will remember.
About the template
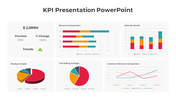
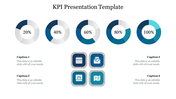
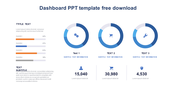
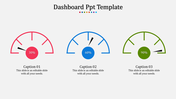
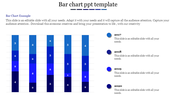
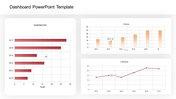
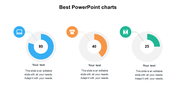
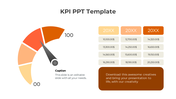
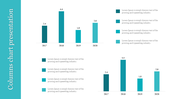
The KPI PPT Template Free is a four-noded template with an attractive KPI dashboard. It has a line chart to present your business report, a bar chart for your business growth, a pie chart for your sales analysis, and a column chart to visualize your performance measurement. These charts have multi-colors to differentiate your data. It will make your presentation easy to read and understand. It will help you to make a professional-looking presentation without any difficulties.
The KPI PPT Template Free helps make it easy for anyone in your organization to understand the statistical reports presented to them. It is an entirely editable slide, so it will be very easy to modify the charts, colors, background, nodes, etc., according to your needs. In addition, it will help you to present your business statistics in an easy and engaging manner that will allow you to attract new and potential clients.
Features of this slide
1. 100 % customizable slides and easy to download.
2. Slides available in different nodes & colors.
3. The slide contained 16:9 and 4:3 format.
4. Easy to change the slide colors quickly.
5. Well-crafted template with instant download facility.
6. A visually engaging KPI presentation template.
7. Multi-color scheme of this slide will make your presentation easy to understand.


You May Also Like These PowerPoint Templates
Add to Wishlist
Download
Edit

Add to Wishlist
Download
Edit

Add to Wishlist
Download
Edit

Add to Wishlist
Download
Edit

Add to Wishlist
Download
Edit


Add to Wishlist
Download
Edit

Add to Wishlist
Download
Edit

Add to Wishlist
Download
Edit

Add to Wishlist
Download
Edit


Add to Wishlist
Download
Edit

Add to Wishlist
Download
Edit


Add to Wishlist
Download
Edit


Add to Wishlist
Download
Edit

Add to Wishlist
Download
Edit


Add to Wishlist
Download
Edit
