Dashboard PowerPoint Template for Business Monitoring

Laptop screen displaying a blue bar chart, surrounded by business dashboard elements placed in dark background.
P.ID : 31528
    463 views
    21 Downloads
    Get Custom Slides by Experts
    Instantly Access Templates in PowerPoint

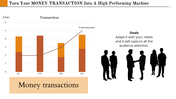
    Dashboard Presentation Template

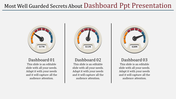
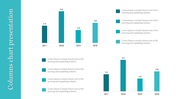
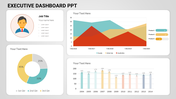
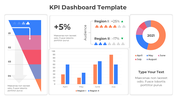
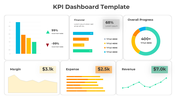
    Tired of boring tables for your data? Say hello to our dynamic dashboard PowerPoint template and Google Slides! With a sleek black background, it features a vibrant blue bar graph chart and three circles to highlight your key points. There's plenty of room for text, so you can add insights and context easily. Whether you're a business pro, educator, or student, this template makes data presentation a breeze. It serves as a versatile tool for enhancing data communication and engaging audiences across different fields. Just plug in your data and customize the layout for a visually stunning dashboard. Download it today and elevate your presentations. With clear communication and engaging visuals, you'll impress any audience and confidently drive your decisions with data. Say goodbye to dull presentations and hello to impactful storytelling with our professional template!

    Features of the template:

    • Slides are available in different nodes & colors.
    • Easy to change the slide colors.
    • Well-crafted template with instant download.
    Advertisement

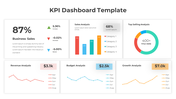
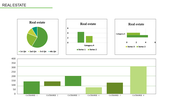
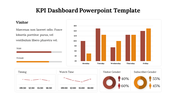
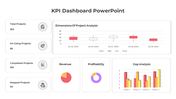
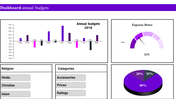
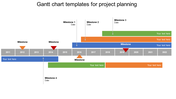
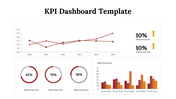
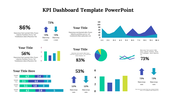
    You May Also Like These PowerPoint Templates

    Free
    Add to Wishlist
    Download
    AI Customize
    Chart slide with four interlinked circular diagrams, and two radar charts in blue and green at the bottom.
    Free
    Add to Wishlist
    Download
    AI Customize
    Pie chart with four segments in white and green on a dark patterned background, alongside a text box for description.
    Free
    Add to Wishlist
    Download
    AI Customize
    World map infographic surrounded by six segments with icons for business-related captions and caption areas.
    Add to Wishlist
    Download
    AI Customize
    Slide featuring a financial report with bar charts and a table, showing website and a percentage statistic on the right.
    Free
    Add to Wishlist
    Download
    AI Customize
    Horizontal bar chart with green and gray bars of varying lengths, labeled with placeholder text, on a light background.
    Free
    Add to Wishlist
    Download
    AI Customize
    Pie chart PPT slide with four sections in different colors and percentages, with accompanying text labels for each section.
    Add to Wishlist
    Download
    AI Customize
    KPI dashboard slide with key metrics for business, development, and downloads, showing percentages with icons.
    Free
    Add to Wishlist
    Download
    AI Customize
    Free KPI PPT Template For Presentation & Google Slides
    Free
    Add to Wishlist
    Download
    AI Customize
    KPI PPT Template with three colourful circular progress charts  showing percentages, growth indicators, and  bar charts.
    Add to Wishlist
    Download
    AI Customize
    KPI dashboard slide showing multiple charts, including bar, line, pie, and gauge charts with tracking business data.
    Free
    Add to Wishlist
    Download
    AI Customize
    KPI Template PPT Presentation Slide With Bar Chart
    Add to Wishlist
    Download
    AI Customize
    Four semi circular charts showing shipment percentages by country, with icons below for delivery status and order rates.
    Add to Wishlist
    Download
    AI Customize
    KPI report slide displaying software sales, downloads, and attendance metrics with speedometer gauges and growth indicators.
    Add to Wishlist
    Download
    AI Customize
    Logistics KPI PowerPoint Template and Google Slides
    Add to Wishlist
    Download
    AI Customize
    Two circular charts show metrics in red and green, representing key performance indicators for warehouse operations.
    Add to Wishlist
    Download
    AI Customize
    KPI slide highlighting essential business metrics alongside color coded sections for quick reference and analysis.
    Add to Wishlist
    Download
    AI Customize
    Four colored semicircles for country data with percentages, and bottom section with three colorful circles for metrics.