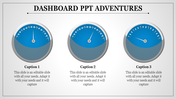
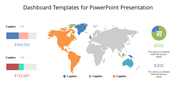
Customized Sales Performance Dashboard Examples Slide

Sales performance dashboard PowerPoint template with a line graph, pie chart, and percentage change analysis.
P.ID : 41723
    134 views
    12 Downloads
    Get Custom Slides by Experts
    Instantly Access Templates in PowerPoint

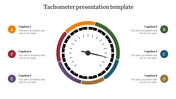
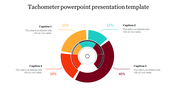
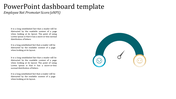
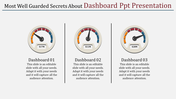
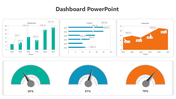
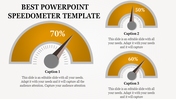
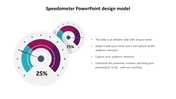
    Professional Dashboard Slide For Your Needs

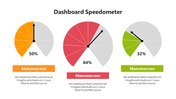
    It will be challenging for you to present the sales information in a text when we have a lot of data to show. As a result, we have created a sales performance dashboard template to help you create a visual presentation. The audience can quickly and readily comprehend it. To make the slide visually appealing, we have also added imaginative color tones. It is a pre-made presentation, so you can rapidly add your data and present it in a minute. Test it out!

    Features of the template

    • 100% customizable slides and easy to download.
    • Slides are available in different nodes & colors.
    • The slide contained 16:9 and 4:3 formats.
    • Easy to change the slide colors quickly.
    • It is a well-crafted template with an instant download facility.
    • It is a 100% pre-designed slide.
    • The slide is free to edit.
    Advertisement

    You May Also Like These PowerPoint Templates

    Add to Wishlist
    Download
    AI Customize
    Sales performance dashboard PPT template with a colorful circular segmented chart and percentage indicators with icons.
    Add to Wishlist
    Download
    AI Customize
    Green themed dashboard template with three plant growth in line, bar and area chart for different years and species.
    Add to Wishlist
    Download
    AI Customize
    Tachometer PowerPoint template with four stages featuring colorful gauges and caption areas on a white backdrop.
    Add to Wishlist
    Download
    AI Customize
    Dashboard template with two horizontal bar charts, a calendar icon, and circular progress indicators in orange and green.
    Add to Wishlist
    Download
    AI Customize
    Dashboard slide showcasing a semi circular layout with five numbered segments in blue, red, and green, each with captions.
    Add to Wishlist
    Download
    AI Customize
    Laptop screen displaying a blue bar chart, surrounded by business dashboard elements placed in dark background.
    Add to Wishlist
    Download
    AI Customize
    Infographic featuring two red semicircular speedometers with needles, displaying percentages, and captions below.
    Add to Wishlist
    Download
    AI Customize
    Purple themed dashboard slide featuring multiple charts and a text box for descriptive content.
    Add to Wishlist
    Download
    AI Customize
    Dashboard slide with three blue icons and captions paired with a bar chart on a tablet screen, and a desk setup on the right.
    Add to Wishlist
    Download
    AI Customize
    Yellow speedometer graphic indicating 70%, with a gray needle pointing right and a caption area below.
    Add to Wishlist
    Download
    AI Customize
    Black circular speedometer gauge with a green needle, surrounded by six captions on a white background.
    Free
    Add to Wishlist
    Download
    AI Customize
    Circular speedometer infographic with a black needle, yellow progress arc, and distance markers, next to an text box.
    Add to Wishlist
    Download
    AI Customize
    Sales performance dashboard PowerPoint template with a line graph, pie chart, and percentage change analysis.
    Add to Wishlist
    Download
    AI Customize
    Chart design slide tracking article likes, comments, shares, total posts, and new subscriber growth with visual graphs.
    Add to Wishlist
    Download
    AI Customize
    Speedometer PowerPoint template with yellow background showing a 70 percent reading, along with 50 and 60 percent gauges.
    Add to Wishlist
    Download
    AI Customize
    Executive dashboard featuring a bar chart of project tasks, pie chart for project distribution, and a line graph.
    Free
    Add to Wishlist
    Download
    AI Customize
    Speedometer graphic with a blue progress bar, labeled distance values, and a right-side text box explaining its concept.
    Add to Wishlist
    Download
    AI Customize
    Chart PPT template with bar graphs showing clicks and recipients, a pie chart for email categories, and a line graph.