PowerPoint Dashboard Template for Data Visualization


Dashboard PowerPoint Template and Google Slides Themes
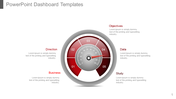
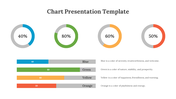
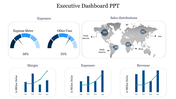
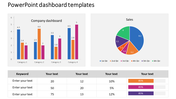
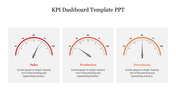
Efficiently monitor and manage your business metrics with our Dashboard PowerPoint Template. Featuring a sleek speedometer design, this template allows you to gauge the quantity or quality of your processes with precision. The speedometer serves as a visual representation of performance, offering a clear and intuitive way to track progress and identify areas for improvement.
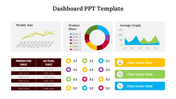
With ample space for text, you can provide detailed insights and analysis to accompany the visual data. Whether you're presenting key performance indicators, project milestones, or financial metrics, this template is designed to help you communicate complex information effectively.
Compatible with both PowerPoint and Google Slides, our Dashboard Template offers versatility and convenience for seamless integration into your presentations. Elevate your reporting and decision-making processes with our Dashboard PowerPoint Template today!
Features of the template
- 100% customizable slides and easy to download.
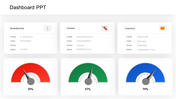
- Slides are available in different nodes & colors.
- The slide contains 16:9 and 4:3 formats.
- It is easy to change the colors of the slide quickly.
- Well-crafted template with an instant download facility.


You May Also Like These PowerPoint Templates
Add to Wishlist
Download
Edit


Add to Wishlist
Download
Edit

Add to Wishlist
Download
Edit

Add to Wishlist
Download
Edit

Add to Wishlist
Download
Edit

Add to Wishlist
Download
Edit

Add to Wishlist
Download
Edit

Add to Wishlist
Download
Edit

Add to Wishlist
Download
Edit

Add to Wishlist
Download
Edit

Add to Wishlist
Download
Edit

Add to Wishlist
Download
Edit

Add to Wishlist
Download
Edit

Add to Wishlist
Download
Edit


Add to Wishlist
Download
Edit

Add to Wishlist
Download
Edit

Add to Wishlist
Download
Edit
