Free - Amazing PowerPoint Dashboard Templates Presentation

Free
Red-themed circular gauge divided into five sections from direction to business, with a central needle indicator.
P.ID : 35770
    356 views
    131 Downloads
    Get Custom Slides by Experts
    Instantly Access Templates in PowerPoint

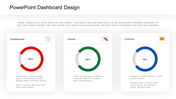
    PowerPoint dashboard templates and Google Slides

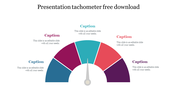
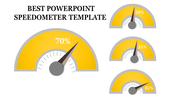
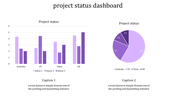
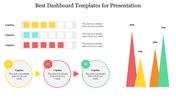
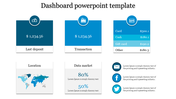
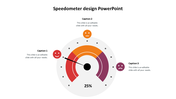
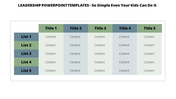
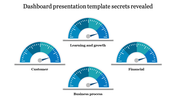
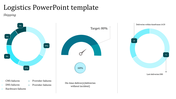
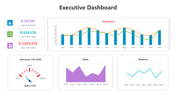
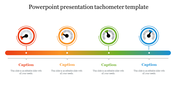
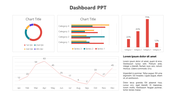
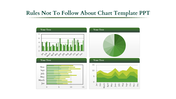
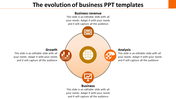
    PowerPoint dashboard templates seamlessly combine functionality and aesthetics, offering a dynamic visual representation of complex data. These templates, enriched with professional shades and colors, elevate the standard of dashboard design. With five nodes strategically placed, they enhance data organization and clarity. Ideal for creative presentations, these templates transform raw information into compelling narratives, capturing audience attention. Moreover, when applied to business presentations, these dashboards become indispensable tools, facilitating comprehensive data analysis. The inclusion of a balance sheet template as a secondary keyword underscores their versatility, emphasizing their relevance in financial presentations. Elevate your presentations with these meticulously crafted PowerPoint dashboard templates, striking the perfect balance between visual appeal and data-driven insights.

    Features of the template:

    • Slides are available in different nodes & colors.
    • Easy to change the slide colors.
    • Well-crafted template with instant download.
    • 100 % customizable slides and easy to download.
    • Well-crafted template with instant download.
    Advertisement

    You May Also Like These PowerPoint Templates

    Add to Wishlist
    Download
    AI Customize
    Executive dashboard slide with a gauge displaying performance across different levels, labeled three sections.
    Add to Wishlist
    Download
    AI Customize
    Slide with a businesswoman standing beside a colorful ring chart labeled on a board and four captions on the right.
    Add to Wishlist
    Download
    AI Customize
    Marketing KPI template with three circular icons, and bar and line charts in blue, gray, and green below.
    Add to Wishlist
    Download
    AI Customize
    Best Elegant Tachometer Presentation Download Template
    Free
    Add to Wishlist
    Download
    AI Customize
    Circular speedometer design with a red progress arc from 5.5 to 6.5 KM, and a gray caption box for customizable text content.
    Add to Wishlist
    Download
    AI Customize
    Speedometer style dashboard template with green, yellow, and red zones for progress tracking with captions.
    Add to Wishlist
    Download
    AI Customize
    Dashboard layout showing net worth value, asset categories in a pie chart, and bar chart for real estate comparisons.
    Add to Wishlist
    Download
    AI Customize
    Slide showcasing data visualizations using donut, bar, column, line charts, and a text box, using yellow highlights.
    Add to Wishlist
    Download
    AI Customize
    Business dashboard slide with a monitor displaying charts and graphs, paired with four colored icons and captions.
    Add to Wishlist
    Download
    AI Customize
    Slide design featuring three green speedometer graphics displaying different progress levels, each paired with a caption.
    Add to Wishlist
    Download
    AI Customize
    Sales performance dashboard with four circular progress charts in orange, blue, purple, and green, showing percentage values.
    Add to Wishlist
    Download
    AI Customize
    Dashboard slide featuring six sections with graphs and metrics for annual performance in blue and green.
    Add to Wishlist
    Download
    AI Customize
    Effective Dashboard PowerPoint Templates Design
    Add to Wishlist
    Download
    AI Customize
    Dashboard slide with a circular chart in blue shades, featuring percentage labels, and five icons with text on the right.
    Add to Wishlist
    Download
    AI Customize
    Dashboard slide with a pie chart, stacked area chart, and multiple colored rectangular boxes displaying metrics.
    Add to Wishlist
    Download
    AI Customize
    Best Dashboard Sales Performance Reports Revenue Charts