Attractive Speedometer Design PowerPoint Presentation

Colorful speedometer PPT slide with a gauge showing 25 percent and corresponding happy and sad faces with captions.
P.ID : 51859
    157 views
    17 Downloads
    Get Custom Slides by Experts
    Instantly Access Templates in PowerPoint

    The Best Collection Of Template:


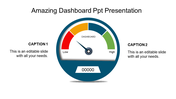
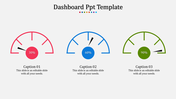
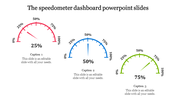
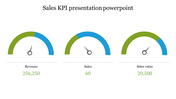
    Own this speedometer design PowerPoint template to provide a detailed explanation about your desired business and general topics. You can provide a profound illustration through the three-node given here, which are colorful with their attractive diagram and graphics. 

    The white background color highlights the speedometer diagram and gives a vibrant look to your presentation. You can also find that these three nodes carry caption space, which you can alter according to your needs. So, download this speedometer design PowerPoint template to gain everybody's attention.

    Features Of This Template:

    • 100% customizable slides and easy to download
    • Slides are available in different nodes & colors.
    • The slides contained 16:9 and 4:3 format.
    • Easy to change the slide colors quickly.
    • Well-crafted Template with instant download facility.
    • Crisp and elegant font style. 
    • The best Template with attractive nodes.
    Advertisement

    You May Also Like These PowerPoint Templates

    Free
    Add to Wishlist
    Download
    AI Customize
    Dashboard template with a circular speedometer gauge in the center, divided into five blue segments labeled 01 to 05.
    Free
    Add to Wishlist
    Download
    AI Customize
    Colorful project dashboard PPT slide showing a bar chart for four sections with a pie chart detailing percentages.
    Add to Wishlist
    Download
    AI Customize
    Central speedometer style gauge with red, yellow, blue, and green sections, surrounded by numbered text boxes.
    Add to Wishlist
    Download
    AI Customize
    KPI dashboard with a dual-line graph, balance performance gauge, and quarterly income metrics.
    Free
    Add to Wishlist
    Download
    AI Customize
    Project dashboard with a table containing rows for tasks, dates, and signature for author, client, and manager approval.
    Add to Wishlist
    Download
    AI Customize
    Business dashboard with progress indicators for promotion, channel management, and revenue metrics.
    Free
    Add to Wishlist
    Download
    AI Customize
    Colorful dashboard style meters PPT slide with captions and placeholder text.
    Free
    Add to Wishlist
    Download
    AI Customize
    Dashboard layout featuring a line graph, pie chart, net worth value, and categorized assets and liabilities in green theme.
    Free
    Add to Wishlist
    Download
    AI Customize
    Executive dashboard slide featuring different vehicles like bike, car, container, train, and plane with title sections.
    Free
    Add to Wishlist
    Download
    AI Customize
    Executive dashboard template featuring six blue columns with titles and alternating light and dark blue text boxes.
    Add to Wishlist
    Download
    AI Customize
    Colorful dashboard PPT template featuring financial figures, text placeholders, and a radar chart for visual data analysis.
    Free
    Add to Wishlist
    Download
    AI Customize
    PowerPoint template featuring a colorful dashboard with bar graphs, pie charts, progress rings, and a timeline for data.
    Free
    Add to Wishlist
    Download
    AI Customize
    Dashboard layout includes a line graph, pie chart, and three bar graphs, all colored in red, green, and blue.
    Add to Wishlist
    Download
    AI Customize
    KPI dashboard slide featuring six charts vertical bars, horizontal bars, area graph, pie chart, and column bar graphs.
    Add to Wishlist
    Download
    AI Customize
    KPI dashboard highlighting supplier statistics using donut charts, order-to-invoice process, and bar charts.
    Free
    Add to Wishlist
    Download
    AI Customize
    A slide with a sleek dashboard design that includes colorful data visualizations like pie charts, graphs, and progress bars.
    Free
    Add to Wishlist
    Download
    AI Customize
    KPI slide displaying three circular meters with red, green, and orange sections, with text descriptions on the right.