Dashboard PPT Presentation Template And Google Slides Themes

Red themed dashboard with multiple charts like line, donut, bar, and stacked bar for various data metrics.
P.ID : 2580
    826 views
    151 Downloads
    Get Custom Slides by Experts
    Instantly Access Templates in PowerPoint

    Effortless Dashboard Theme Presentation Template


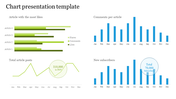
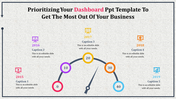
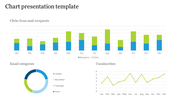
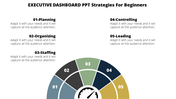
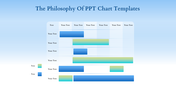
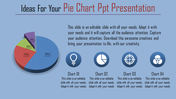
    Experience the convenience of our Effortless Dashboard PPT Presentation Template, designed to streamline your data visualization process with ease. With a vibrant red color theme and multiple nodes, this template offers a visually appealing backdrop for your business presentations. Whether you're showcasing financial metrics, project progress, or sales performance, our user-friendly design allows for seamless editing and customization. Easily adjust charts, graphs, and text to suit your specific needs, saving you valuable time and effort in preparing professional presentations. Empower your audience with clear, concise insights presented in a visually engaging format. Impress clients, colleagues, and stakeholders with polished, data-driven presentations that leave a lasting impact. Elevate your storytelling and drive decision-making with our Easy to Edit Dashboard PPT Presentation Template.


    Features of this template:

    • 100% customizable slides and easy to download.
    • Slides available in different nodes & colors.
    • The slide contained 16:9 and 4:3 format.
    • Easy to change the slide colors quickly.
    • Well-crafted template with instant download facility.
    Advertisement

    You May Also Like These PowerPoint Templates

    Add to Wishlist
    Download
    AI Customize
    Amazing PowerPoint Dashboard Presentation Template
    Add to Wishlist
    Download
    AI Customize
    Circular tachometer gauge with a needle pointing six colored sections, and captions in rounded rectangles connected by lines.
    Add to Wishlist
    Download
    AI Customize
    Gantt chart PowerPoint template displaying project tasks over a four week timeline with placeholder text.
    Add to Wishlist
    Download
    AI Customize
    Versatile PowerPoint Chart Templates for Data Insights
    Add to Wishlist
    Download
    AI Customize
    Horizontal bar chart with three color-coded series, labeled values, and a left side legend with numbered captions.
    Free
    Add to Wishlist
    Download
    AI Customize
    Circular gauge style infographic in shades of gray, showing a speedometer with a needle and distance markers.
    Add to Wishlist
    Download
    AI Customize
    Business executive dashboard template displaying project information, including date and editor with placeholder text.
    Add to Wishlist
    Download
    AI Customize
    A tachometer PowerPoint template with five dials in different colors, each representing a specific section with captions.
    Add to Wishlist
    Download
    AI Customize
    Slide deck with multiple circular progress bars in various colors, showing percentages and captions below.
    Add to Wishlist
    Download
    AI Customize
    Slide with a horizontal bar chart on the left and 3D cylindrical percentage charts in blue, green, and teal, on the right.
    Add to Wishlist
    Download
    AI Customize
    Horizontal bar chart with four labeld sections A to D, in purple, pink, teal, and blue, and captions below.
    Add to Wishlist
    Download
    AI Customize
    Business chart slide with a red and black line graph on the left, a red bar chart on the right, and two description sections.
    Add to Wishlist
    Download
    AI Customize
    Dashboard themed slide with a semi circular gauge showing four icons for speedometers and a central needle pointer.
    Add to Wishlist
    Download
    AI Customize
    Dashboard layout with gauges, bar charts, line graphs, and progress indicators for business performance metrics.
    Add to Wishlist
    Download
    AI Customize
    Business dashboard with expense bar chart, executive distribution, sales pie chart, and revenue gauge.
    Free
    Add to Wishlist
    Download
    AI Customize
    Purple bar chart PPT slide with years 2018 to 2021 and percentages and a businesswoman presenting the information.
    Add to Wishlist
    Download
    AI Customize
    Green speedometer graphics illustrating performance levels at 70, 50, 55, and 85 percent in a PowerPoint template.