Infographic PowerPoint for Visual Data Presentation

 Canva
Canva

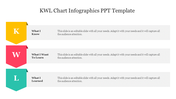
Best Infograhic Presentation Template
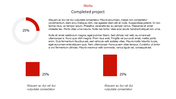
Introducing our captivating Infographic PowerPoint Template, now available for Google Slides Themes! This sleek template features a modern design with a clean white background, making your content stand out. With its intuitive 4-step layout, it guides your audience effortlessly through key concepts and takeaways. Whether you're presenting data, trends, or processes, this template will grab the attention of your viewers and leave a lasting impression. Elevate your presentations with professionalism and engagement by incorporating our Infographic PowerPoint Template into your next slideshow.
Feature of the template
- 100% customizable slides and easy to download.
- Slides are available in different nodes & colors.
- The slide is contained in 16:9 and 4:3 format.
- Easy to change the slide colors quickly.
- Well-crafted template with an instant download facility.


You May Also Like These PowerPoint Templates
Add to Wishlist
Download
AI Customize

Add to Wishlist
Download
AI Customize

Add to Wishlist
Download
AI Customize

Add to Wishlist
Download
AI Customize

Add to Wishlist
Download
AI Customize

Add to Wishlist
Download
AI Customize

Add to Wishlist
Download
AI Customize

Add to Wishlist
Download
AI Customize

Add to Wishlist
Download
AI Customize

Add to Wishlist
Download
AI Customize

Add to Wishlist
Download
AI Customize

Add to Wishlist
Download
AI Customize

Add to Wishlist
Download
AI Customize

Add to Wishlist
Download
AI Customize

Add to Wishlist
Download
AI Customize

Add to Wishlist
Download
AI Customize

Add to Wishlist
Download
AI Customize

Free
Add to Wishlist
Download
AI Customize

Add to Wishlist
Download
AI Customize

Add to Wishlist
Download
AI Customize
