Charts And Graphs PowerPoint Template And Google Slides

PowerPoint slide with multiple charts and graphs, including a line chart, bar chart, and area chart, each with captions.
P.ID : 10812
    500 views
    8 Downloads
    Get Custom Slides by Experts
    Instantly Access Templates in PowerPoint

    Charts and Graphs Presentation Template

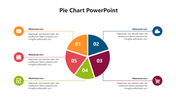
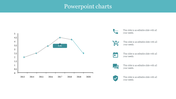
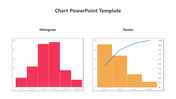
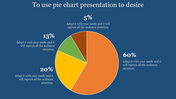
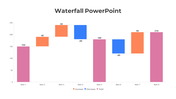
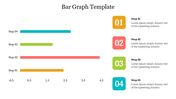
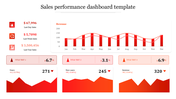
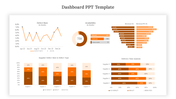
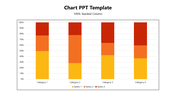
    Want to make your presentations more interesting? Our "Charts and Graphs PowerPoint Template and Google Slides can help! It has a clean, professional look with four bar charts and graphs on a white background. Each chart has a text box so you can easily add your data. Whether you're a pro or a beginner, this template lets you tell your story effectively. Use it to show trends, compare data, or just make your slides more eye-catching. It's easy to customize too – change nodes, fonts, and sizes to match your style. With this chart PPT template, you can wow your audience and make your message stick. Download the Template now and see the power of visualizing data!

    Features of the template:

    • Slides are available in different nodes & colors.
    • Easy to change the slide colors.
    • Well-crafted template with instant download.
    Advertisement

    You May Also Like These PowerPoint Templates

    Add to Wishlist
    Download
    AI Customize
    Dark themed layout featuring four pie charts with shaded segments, each displaying different percentages.
    Add to Wishlist
    Download
    AI Customize
    Stacked traction bar graph with red, blue, green, orange bars labeled with percentage values and caption areas.
    Add to Wishlist
    Download
    AI Customize
    Cash flow dashboard with a vertical bar chart and two horizontal stacked bar charts detailing revenue categories.
    Add to Wishlist
    Download
    AI Customize
    Green shaded bar chart displaying data from 2016 to 2021, with three numbered captions below.
    Add to Wishlist
    Download
    AI Customize
    Chart slide showing market supply data from 2004 to 2014 with red bars and percentage annotations.
    Add to Wishlist
    Download
    AI Customize
    Dashboard with four bar charts in yellow, green, teal, and red, comparing project risks and change requests.
    Add to Wishlist
    Download
    AI Customize
    Comparison slide featuring male and female icons, paired with captions and bar chart below, in blue and green tones.
    Add to Wishlist
    Download
    AI Customize
    Three circular dashboard dials with red, blue, and brown segments, each containing captions below.
    Add to Wishlist
    Download
    AI Customize
    Slide featuring a dashboard with three dials labeled Low, Mid, and High, indicating various levels of measurement.
    Add to Wishlist
    Download
    AI Customize
    Slide with pie charts, line graphs, and a bar chart in shades of green, illustrating data trends and comparisons.
    Free
    Add to Wishlist
    Download
    AI Customize
    PowerPoint slide showcasing projected cash flows, NPV for 3 and 5 years, and payback period with client testimonial.
    Free
    Add to Wishlist
    Download
    AI Customize
    Infographic of a bar chart representing yearly growth from 2018 to 2021 with a businesswoman illustration.
    Add to Wishlist
    Download
    AI Customize
    Circular pie chart divided into five colored sections noted with percentages, with corresponding boxes for text area.
    Add to Wishlist
    Download
    AI Customize
    Three panel dashboard with column, bar, and funnel charts at the top and numbered blue boxes with text below.
    Free
    Add to Wishlist
    Download
    AI Customize
    3D bar chart PowerPoint template showcasing data in four colored categories with a highlight and captions.
    Free
    Add to Wishlist
    Download
    AI Customize
    KPI dashboard layout with blue semicircle gauges and line charts representing social media performance metrics.