Affordable KPI Dashboard PowerPoint Template Presentation

Three panel dashboard with column, bar, and funnel charts at the top and numbered blue boxes with text below.
P.ID : 2132
    1.5K+ views
    48 Downloads
    Get Custom Slides by Experts
    Instantly Access Templates in PowerPoint

    KPI Dashboard PowerPoint Template


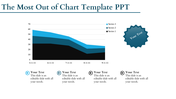
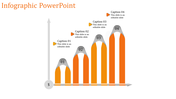
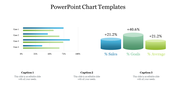
    Transform your KPI presentations into visual win with our PowerPoint slide. The slides have three dynamic columns.The top section has bars, columns, and charts.The bottom section provides concise captions, followed by a subtle color to differentiate the sections. It creates a balance that enhances better understanding about key factors. 

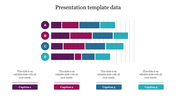
    From performance metrics to growth indicators, these captions guide the audience through the significance of each KPI. Tailored for executives, analysts, and strategists. This slide seamlessly adapts to various scenarios – from boardroom presentations to team briefings. 

    Suitable slide, if you are analyzing financial metrics, marketing performance,  seeking operational efficiency. Apt for those looking to assess departmental goals, company-wide performance. Download our template to let your key performing factors tend to success.

    Features of the Template

    • Editable colors and text 
    • Easy downloadable options
    • Completely customisable template
    • The slide contains 16:4 and 4:3 format
    • Suitable for PowerPoint and Google slides themes.
    Advertisement

    You May Also Like These PowerPoint Templates

    Free
    Add to Wishlist
    Download
    AI Customize
    Purple bar chart PPT slide with years 2018 to 2021 and percentages and a businesswoman presenting the information.
    Free
    Add to Wishlist
    Download
    AI Customize
    Layered area chart with Series 1 in yellow, Series 2 in orange, and Series 3 in black, showing data trends over time.
    Add to Wishlist
    Download
    AI Customize
    Clustered bar chart comparing data across quarters with horizontal bars in various colors.
    Add to Wishlist
    Download
    AI Customize
    Slide with three vertical boxes in blue, red, and green banners, and rounded icons labeled K, W, and L for learning stages.
    Add to Wishlist
    Download
    AI Customize
    Line graph infographic showing data from 2015 to 2020, with three colored lines in purple, yellow, and green, and text.
    Add to Wishlist
    Download
    AI Customize
    Donut chart in blue and orange displaying percentage, with matching colored caption boxes on either side.
    Add to Wishlist
    Download
    AI Customize
    Our Predesigned Chart Templates PPT Slides Designs
    Add to Wishlist
    Download
    AI Customize
    KWL chart slide with three columns in blue, red, and gold, representing learning insights.
    Add to Wishlist
    Download
    AI Customize
    Infographic with four bar graphs, each showing data points A to D, and captions areas in green boxes.
    Add to Wishlist
    Download
    AI Customize
    Slide with four pie charts in green and blue, paired with text boxes, and a silhouette of a woman holding a bag on the right.
    Free
    Add to Wishlist
    Download
    AI Customize
    PowerPoint presentation slide featuring a stacked bar chart, aerial landscape photo, and a comparison table of drone data.
    Free
    Add to Wishlist
    Download
    AI Customize
    PowerPoint slide with a circular pie chart showing four segments labeled with percentages and a placeholder text.
    Add to Wishlist
    Download
    AI Customize
    Customized Kubler Ross PowerPoint Presentation Template
    Add to Wishlist
    Download
    AI Customize
    Visual of boost engagement growth with stacked bar categories: newsletter sign-ups, premium customers, and followers.
    Add to Wishlist
    Download
    AI Customize
    Pie charts showing data percentages for growth, with three percentage values with placeholder text.
    Free
    Add to Wishlist
    Download
    AI Customize
    Chart infographic with four drop shaped gauge style meters in blue, green, yellow, and red, each with text below.
    Add to Wishlist
    Download
    AI Customize
    Dual chart template slide with scatter and bubble charts, the scatter chart on the left and the bubble chart on the right.
    Free
    Add to Wishlist
    Download
    AI Customize
    Slide with green and white sections, featuring pie and bar charts, and an engine image in the bottom right corner.
    Add to Wishlist
    Download
    AI Customize
    Chart with five blue vertical bars showing percentages, paired with captions, on a white background.