Mind-Blowing Chart Presentation Template For Your Needs

Chart presentation template displaying monthly data for Visitors, New Customers, and Leads with bar and line charts.
P.ID : 34131
    291 views
    22 Downloads
    Get Custom Slides by Experts
    Instantly Access Templates in PowerPoint

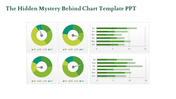
    Mind-blowing Pie chart Presentation

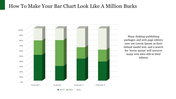
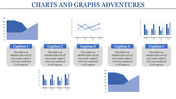
    Do you require a variety of charts to display your data? This bar graph is the best option for you. These data infographics will benefit anyone in research, business, marketing, education, or medicine. Pie chart designs that are contemporary and tidy avoid showy design and cluttering features. This effective PowerPoint data chart template shows precisely that kind of design. Save this single-noded graphical depiction to your computer to make your audience fly. Try now!

    Features of the template

    • 100 % customizable slides and easy to download.
    • Slides are available in different nodes & colors.
    • The Slide contained 16:9 and 4:3 formats.
    • Easy to change the slide colors quickly.
    • It is a well-crafted template with an instant download facility.
    • It is designed with a stunning theme design.
    • Best Pie chart graphical Presentations.
    Advertisement

    You May Also Like These PowerPoint Templates

    Add to Wishlist
    Download
    AI Customize
    Creative charts showing a circular 60% approval metric, bar graphs, and a 55% Twitter engagement donut chart.
    Free
    Add to Wishlist
    Download
    AI Customize
    Gantt chart plan template showing tasks across months with a colorful circular pie chart and matching bars on theright.
    Add to Wishlist
    Download
    AI Customize
    Financial highlights slide with bar chart and circular gauges tracking sales, operating income, and expenses.
    Add to Wishlist
    Download
    AI Customize
    Project schedule slide with a Gantt chart displaying tasks, timelines, and completion percentages.
    Free
    Add to Wishlist
    Download
    AI Customize
    Dashboard with line graphs, a circular chart with three segments, and labeled financial metrics, in red, orange, and green.
    Add to Wishlist
    Download
    AI Customize
    Dashboard slide showing Zantedeschia, Celosia, and Calendula growth data with a bar chart from 2012 to 2017.
    Add to Wishlist
    Download
    AI Customize
    A dashboard style slide showing plant growth data for Zantedeschia, Celosia, and Calendula with gauge charts and a bar graph.
    Free
    Add to Wishlist
    Download
    AI Customize
    Comparison of revenue and cost distributions with pie charts displaying CAPEX and OPEX percentages.
    Free
    Add to Wishlist
    Download
    AI Customize
    Horizontal Gantt chart showing tasks by days with segments in blue, purple, and black, indicating task progress and status.
    Add to Wishlist
    Download
    AI Customize
    Funnel infographic with blue, red, yellow, and green sections, each with icons, connected to text descriptions.
    Free
    Add to Wishlist
    Download
    AI Customize
    Four vertical orange columns and percentages, labeled by year, along with a businesswoman illustration on the right.
    Add to Wishlist
    Download
    AI Customize
    Botanical data dashboard template  showing performance metrics for flower species, featuring line and bar charts.
    Add to Wishlist
    Download
    AI Customize
    PowerPoint slide with multiple chart types, including bar, line, and pie charts with different styles.
    Free
    Add to Wishlist
    Download
    AI Customize
    Chart with colorful bars representing yearly data from 2013 to 2020, paired with eight colorful cube icons on the sides.
    Add to Wishlist
    Download
    AI Customize
    Gantt chart PPT slide displaying tasks with start and end dates, milestones, and progress tracking for each month.
    Add to Wishlist
    Download
    AI Customize
    Infographic chart with a truck carrying five colorful blocks and percentage bars, using green, orange, and brown tones.
    Free
    Add to Wishlist
    Download
    AI Customize
    A circular 3D chart in blue, green, purple, and orange representing yearly expansion categories and values.
    Free
    Add to Wishlist
    Download
    AI Customize
    Bar chart PowerPoint slides showcasing different business categories with colorful bars in different layout designs.
    Add to Wishlist
    Download
    AI Customize
    Gantt chart slide with monthly columns showing project tasks and subtasks progress using blue shades to indicate status.
    Free
    Add to Wishlist
    Download
    AI Customize
    Gantt chart slide with monthly timeline across three teams, using blue, orange, and green bars to indicate priority items.