MILESTONE 🌟 5 Million+ creative minds trust SlideEgg! Grab 80% OFF

Chart PowerPoint Presentation and Google Slides Themes

Horizontal bar chart with three color-coded series, labeled values, and a left side legend with numbered captions.
P.ID : 34752
    291 views
    16 Downloads
    Get Custom Slides by Experts
    Instantly Access Templates in PowerPoint

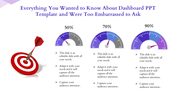
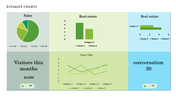
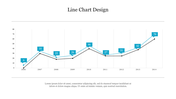
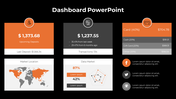
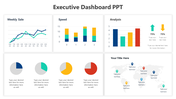
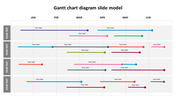
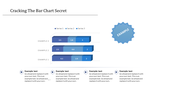
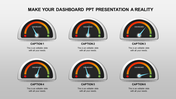
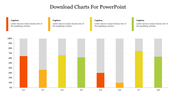
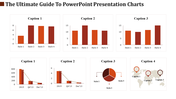
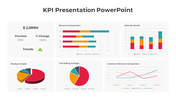
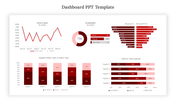
    Chart Presentation Template

    Do you find your data presentations boring? Well, say goodbye to dull tables because our vibrant chart PowerPoint template and Google Slides are here to rescue you! With colourful charts and clear segments, you can make your numbers pop and engage your audience effortlessly. This template includes editable captions explaining key insights, making it perfect for business presentations, academic studies, or educational illustrations. Just input your data, and your information will come to life in a visually stunning way. It is a versatile tool used across various fields to transform data into compelling visuals for effective communication and presentation. Don't let your data drown in numbers! Download the template today and start creating presentations that are not only informative but also visually captivating.

    Features of the template:

    • Slides are available in different nodes & colors.
    • Easy to change the slide colors.
    • Well-crafted template with instant download.
    Advertisement

    You May Also Like These PowerPoint Templates

    Add to Wishlist
    Download
    AI Customize
    Dashboard PPT template with three colored gauges showing 30, 60, and 90 percent completion with captions.
    Add to Wishlist
    Download
    AI Customize
    Slide showing a bar chart with values for 2017, 2018, 2019, and 2020, with each year represented in different shades of blue.
    Add to Wishlist
    Download
    AI Customize
    Matrix chart with skill and will axes, divided into quadrants labeled high and low, with numbered circles and icons.
    Add to Wishlist
    Download
    AI Customize
    PowerPoint chart template displaying three donut charts with percentages and icons representing data categories.
    Add to Wishlist
    Download
    AI Customize
    Project plan Gantt chart template displaying tasks with milestones and progress percentages across months from Jan to Dec.
    Add to Wishlist
    Download
    AI Customize
    KPI PowerPoint template with a gauge and table for displaying yearly financial data on a white backdrop.
    Add to Wishlist
    Download
    AI Customize
    Bar chart presentation showing data from 2017 to 2020, with values 2.4, 4.4, 1.8, and 2.8, respectively.
    Add to Wishlist
    Download
    AI Customize
    Dashboard PPT slide showcasing defect rates, supplier analysis, revenue breakdown, and delivery time analysis with charts.
    Add to Wishlist
    Download
    AI Customize
    KPI PowerPoint slide featuring three colored gauges for Revenue, Sales, and Sales Value with respective values.
    Add to Wishlist
    Download
    AI Customize
    Two vertical bar charts with three columns each, alongside captions with percentages in varying shades of orange.
    Add to Wishlist
    Download
    AI Customize
    KPI dashboard template with bar and line graphs showing private school growth for 2017, 2018, and 2019 with educational data.
    Free
    Add to Wishlist
    Download
    AI Customize
    Free KPI Presentation PPT Template and Google Slides
    Free
    Add to Wishlist
    Download
    AI Customize
    Revenue analysis slide with bar chart, financial icon, and two descriptive sections for customer metrics.
    Add to Wishlist
    Download
    AI Customize
    3D pie chart with four color-coded segments red, orange, yellow, and brown displaying percentage values.
    Add to Wishlist
    Download
    AI Customize
    PPT template for an annual report featuring a bar graph comparing data across three time periods with color coded categories.
    Free
    Add to Wishlist
    Download
    AI Customize
    Bar chart slide with three stacked bars, each divided into segments with percentage labels, and a table on the right.
    Add to Wishlist
    Download
    AI Customize
    Gantt chart layout with five vertical milestone markers in blue, black, brown, green, and yellow.
    Free
    Add to Wishlist
    Download
    AI Customize
    3D bar graph with six green bars of varying heights, labeled placeholders, and a gray sidebar with text blocks.