Editable Dashboard PPT Template Slide Design-Three Node

Dashboard PowerPoint slide featuring three speedometer style gauges displaying percentages with a dartboard graphic.
P.ID : 2583
    860 views
    78 Downloads
    Get Custom Slides by Experts
    Instantly Access Templates in PowerPoint

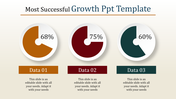
    Vibrant Dashboard Template

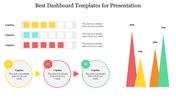
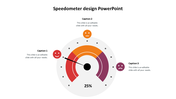
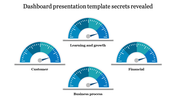
    What is a dashboard, and how do you use it in your presentation? These questions may arise in your mind, don't worry! The dashboard is the virtual representation of your data in a meter format for its rise and fall. The dashboard uses its site page to receive the linked database and metrics. You can use this template to bring data regarding the website fluctuation in a metered model. The three nodes are designed with meters where the dashboard is formatted in vibrant colors. So give this template a try and make it improve. Download now!

    Features of the Template:

    • 100% customizable slides and easy to download.
    • The slide contains 16:9 and 4:3 formats. 
    • Slides are available in different nodes & colors.
    • Easy to change the colors of the slide quickly.
    • Well-crafted template with an instant download facility.
    • Dashboard meter design with text area.
    Advertisement

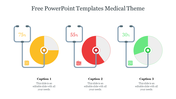
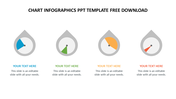
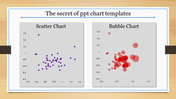
    You May Also Like These PowerPoint Templates

    Free
    Add to Wishlist
    Download
    AI Customize
    Infographic with a circular segmented chart in blue shades, centered around an AI head graphic placed in white background.
    Add to Wishlist
    Download
    AI Customize
    Executive dashboard presentation slide with arrows and title placeholders on a notebook background.
    Add to Wishlist
    Download
    AI Customize
    Tachometer PPT slide with 4 colorful gauges in red, orange, green, and blue, each with caption sections on a white backdrop.
    Add to Wishlist
    Download
    AI Customize
    PowerPoint pie chart template with three segments and associated icons.
    Add to Wishlist
    Download
    AI Customize
    Three vertical rectangular sections with headers in green, blue, and orange, each with captions inside.
    Add to Wishlist
    Download
    AI Customize
    Colorful pie chart PowerPoint slide with five labeled sections and captions on a white backdrop.
    Add to Wishlist
    Download
    AI Customize
    Dashboard PowerPoint slide featuring pie, bar, and line charts with placeholder text and data visualization.
    Free
    Add to Wishlist
    Download
    AI Customize
    Business slide featuring a circular layout with four orange sections and icons representing key aspects of business.
    Free
    Add to Wishlist
    Download
    AI Customize
    Pie chart slide with a blue and dark blue donut chart showing 75% sales, two numbered text boxes on the right.
    Add to Wishlist
    Download
    AI Customize
    Color coded modern dashboard gauge with six labeled sections and a central pointer with captions.
    Add to Wishlist
    Download
    AI Customize
    Executive dashboard slide with a gauge displaying performance across different levels, labeled three sections.
    Add to Wishlist
    Download
    AI Customize
    Slide with a businesswoman standing beside a colorful ring chart labeled on a board and four captions on the right.
    Add to Wishlist
    Download
    AI Customize
    Best Elegant Tachometer Presentation Download Template
    Free
    Add to Wishlist
    Download
    AI Customize
    Circular speedometer design with a red progress arc from 5.5 to 6.5 KM, and a gray caption box for customizable text content.
    Add to Wishlist
    Download
    AI Customize
    Speedometer style dashboard template with green, yellow, and red zones for progress tracking with captions.