Attractive PPT Chart Slide Template Designs With Five Node

 Canva
Canva
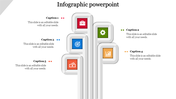

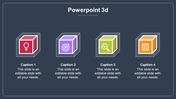
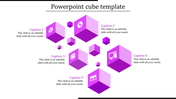
Chart PowerPoint Template and Google Slides Themes
Illuminate your data with the Chart PowerPoint Template and Google Slides Themes. This innovative tool features a sleek graph structure with five nodes, each guiding your audience through complex information effortlessly. Perfect for analysts, marketers, and educators, this template streamlines content delivery for maximum impact.
Unlike outdated designs, this template's nodes direct focus with precision. Improve your reports and captivate your audience with visually appealing slides. Transform your presentations today. Click to download this template and access its user-friendly interface, making it a strategic advantage for anyone looking to make a lasting impression.
Features of the Template
- 100 % customizable slides.
- The slide show is in 4:3, 16:9, zip format.
- There is powerful connectivity with Google Slides and PowerPoint.
- It is simple and quick to alter the slide's color.
- An efficient template that can be easily accessed immediately.
- Well-crafted template with an instant download facility.


You May Also Like These PowerPoint Templates
Add to Wishlist
Download
AI Customize

Add to Wishlist
Download
AI Customize

Add to Wishlist
Download
AI Customize


Add to Wishlist
Download
AI Customize

Add to Wishlist
Download
AI Customize

Add to Wishlist
Download
AI Customize

Add to Wishlist
Download
AI Customize

Add to Wishlist
Download
AI Customize

Add to Wishlist
Download
AI Customize

Add to Wishlist
Download
AI Customize

Add to Wishlist
Download
AI Customize

Add to Wishlist
Download
AI Customize

Add to Wishlist
Download
AI Customize

Add to Wishlist
Download
AI Customize

Add to Wishlist
Download
AI Customize

Add to Wishlist
Download
AI Customize

Add to Wishlist
Download
AI Customize

Add to Wishlist
Download
AI Customize

Add to Wishlist
Download
AI Customize
