Download Now! Stunning Spacing Effect PPT Slide presentation

Download Now! Stunning Spacing Effect PPT Slide presentation
P.ID : 56604
    59 views
    4 Downloads
    Get Custom Slides by Experts
    Instantly Access Templates in PowerPoint

    Interesting Spacing Effect Template

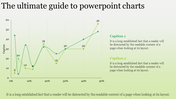
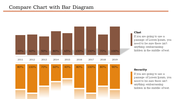
    Are you running an academy? And do you want to space out your study sessions? Then this template will be the best choice for planning your education system. When there is a space between the learning sessions, the interest and effectiveness of learning are increased among students. So when a study session is planned, it is necessary to give a time gap between each session. So explain this record of timing through a proper presentation. Try this fantastic template now and gain the best effect. Download now!

    Features of the Template:

    • 100% customizable slides and easy to download.
    • The slide contains 16:9 and 4:3 formats. 
    • Slides are available in different nodes & colors.
    • Easy to change the colors of the slide quickly.
    • Well-crafted template with an instant download facility.
    • Graph design with text area.
    Advertisement

    You May Also Like These PowerPoint Templates

    Add to Wishlist
    Download
    AI Customize
    Gantt chart slide showing a project timeline with tasks categorized into colorful sections, represented by horizontal bars.
    Add to Wishlist
    Download
    AI Customize
    Pie chart slide showing budget distribution for facebook, google, and linkedIn ads with respective percentages.
    Add to Wishlist
    Download
    AI Customize
    Project management dashboard slide with visually colored charts and graphs displaying task status with icons.
    Add to Wishlist
    Download
    AI Customize
    Visual KPI layout with performance bar chart, doughnut chart, and percentage indicators for project analysis.
    Add to Wishlist
    Download
    AI Customize
    Dashboard PowerPoint Template and Google Slides
    Add to Wishlist
    Download
    AI Customize
    Row of four colored speedometer-style gauges, each showing varying percentages with needle, and captions at the bottom.
    Add to Wishlist
    Download
    AI Customize
    Three pie charts in brown, blue, and green sections, each with labeled percentages and caption lines.
    Free
    Add to Wishlist
    Download
    AI Customize
    Multicolored circular pie chart in yellow, red, and green, with labeled categories listed on the right.
    Add to Wishlist
    Download
    AI Customize
    Four donut charts in red, blue, green, and yellow, displaying percentages with corresponding content boxes below.
    Free
    Add to Wishlist
    Download
    AI Customize
    KPI dashboard with a data table on the left and a circular chart on the right, featuring shades of teal and white.
    Add to Wishlist
    Download
    AI Customize
    A chart with three vertical bars in red, purple, and orange, with icons and descriptive text on the left.
    Free
    Add to Wishlist
    Download
    AI Customize
    Bar chart with five vertical bars representing data analysis with various high, low, and volume indicators displayed.
    Add to Wishlist
    Download
    AI Customize
    A monthly PowerPoint template displaying colorful wave like graphs for each month from January to June with placeholder text.
    Add to Wishlist
    Download
    AI Customize
    KPI themed slide with data visualization including pie charts, bar graphs, line graphs, and key metrics.
    Add to Wishlist
    Download
    AI Customize
    Six semicircular gauges with colored indicators in red, purple, blue, yellow, pink, and green on a white backdrop.
    Free
    Add to Wishlist
    Download
    AI Customize
    Slide showcasing three different types of colored charts an area chart, a bar chart, and a line chart, with captions below.
    Add to Wishlist
    Download
    AI Customize
    Three pie charts with segmented sections and percentage labels, each chart featuring placeholder text below.