Get Simple And Stunning Chart PowerPoint Templates

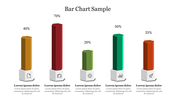
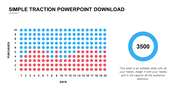
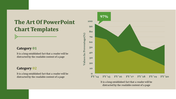
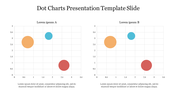
Chart PowerPoint Presentation Template
Optimize your presentation with our Chart PowerPoint template. Our template features a bar chart that represents “Loss” over the years (from 2014 to 2019). The bars in the chart depict varying loss values, and there’s an overlaid line graph that connects the tops of these bars.
Purpose of the Slide: The primary purpose of this slide is to visually convey data related to losses over time. It’s commonly used in presentations, reports, or any context where data needs to be communicated effectively. By presenting this information graphically, the slide allows the audience to quickly grasp trends and changes in loss values across the specified years.
Beneficiaries: Business Executives and Managers, Investors, Analysts and Researchers, Educators and Students.
Click now to explore and elevate your presentation game with stunning, easy-to-use chart templates!
Features of the template:
- Slides are available in 4:3 & 16:9
- Well-crafted template with instant download.
- Get slides that are 100% customizable and easy to download


You May Also Like These PowerPoint Templates
Add to Wishlist
Download
AI Customize

Add to Wishlist
Download
AI Customize

Add to Wishlist
Download
AI Customize

Add to Wishlist
Download
AI Customize

Add to Wishlist
Download
AI Customize

Add to Wishlist
Download
AI Customize

Add to Wishlist
Download
AI Customize


Add to Wishlist
Download
AI Customize

Add to Wishlist
Download
AI Customize

Add to Wishlist
Download
AI Customize

Add to Wishlist
Download
AI Customize

Add to Wishlist
Download
AI Customize

Add to Wishlist
Download
AI Customize

Add to Wishlist
Download
AI Customize

Add to Wishlist
Download
AI Customize

Add to Wishlist
Download
AI Customize

Add to Wishlist
Download
AI Customize

Add to Wishlist
Download
AI Customize

Add to Wishlist
Download
AI Customize
