Customizable KWL Chart PPT Template Presentation

Color coded KWL chart template with sections for What I Know, What I Want to Know, and What I Learned with placeholder text.
P.ID : 65547
    52 views
    7 Downloads
    Get Custom Slides by Experts
    Instantly Access Templates in PowerPoint

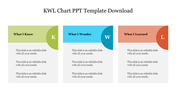
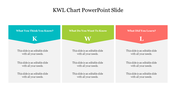
    Three Noded KWL Chart PowerPoint Slide

    Give an elegant look to your education presentations with this attractive KWL Chart PPT Template. It is a perfectly designed info graphic slide, which will help the users to make a professional presentation instantly without any special technical skills. It also provides the features to modify the look and feel of the slide according to your needs. 

    About the template:

    The KWL Chart PPT Template includes three text holders in which the headers are beautifully colored and labeled with the letters K, W, and L. It has sufficient space inside the text boxes to present your findings. It has a neat and perfect layout, which is easy to follow. You can also check this KWL Chart Info graphics PowerPoint Template. Try today!

    Features of this template:

    1. 100% customizable slides and easy to download.
    2. Slides available in different nodes & colors.
    3. The slide contained 16:9 and 4:3 formats.
    4. Easy to change the slide colors quickly.
    5. Well-crafted template with instant download facility.
    6. It is a very creative and well-organized slide.
    Advertisement

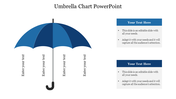
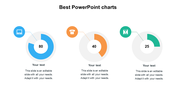
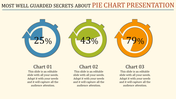
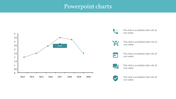
    You May Also Like These PowerPoint Templates

    Add to Wishlist
    Download
    AI Customize
    KPI Infographics PowerPoint And Google Slides Themes
    Add to Wishlist
    Download
    AI Customize
    A project management dashboard slide featuring a table of test case data alongside visual graphs and planned progress.
    Add to Wishlist
    Download
    AI Customize
    A dynamic slide layout featuring a circular pie chart, with labeled segments and placeholder text.
    Add to Wishlist
    Download
    AI Customize
    Two line graphs comparing data trends with different colors, featuring seven data points on each chart.
    Add to Wishlist
    Download
    AI Customize
    Colorful circle chart depicting percentage distribution across four categories, with accompanying captions for each segment.
    Add to Wishlist
    Download
    AI Customize
    Colorful business analytics dashboard displaying bar graphs, line charts, and percentage indicators in a structured layout.
    Add to Wishlist
    Download
    AI Customize
    Stacked column chart with three categories, percentage labels, and circular step icons on both sides with percentage figures.
    Add to Wishlist
    Download
    AI Customize
    A stock chart with five vertical bars in orange and teal, representing financial data for a day period.
    Add to Wishlist
    Download
    AI Customize
    Line chart with labeled high and low points across a fluctuating path, illustrating peaks and troughs in data trends.
    Add to Wishlist
    Download
    AI Customize
    Dashboard layout with income, expenses, profit, and cash flow figures on the left, a project budget chart in the center.
    Add to Wishlist
    Download
    AI Customize
    Dashboard template with pink charts showing facebook and twitter activity, percentage rings, and a page growth graph.
    Add to Wishlist
    Download
    AI Customize
    Line chart template with two lines and labeled data points, along with caption blocks on the left.
    Add to Wishlist
    Download
    AI Customize
    A green circular pie chart showing percentage, and four colored sales data graphs for different years.
    Add to Wishlist
    Download
    AI Customize
    A line graph showing a plot structure with key points marked by colored dots, representing key stages.
    Add to Wishlist
    Download
    AI Customize
    SEO marketing plan template with icons representing different elements like e-commerce, email, and global marketing.
    Add to Wishlist
    Download
    AI Customize
    A donut chart with multiple segments in different colors next to a table displaying statistics and percentage changes.
    Free
    Add to Wishlist
    Download
    AI Customize
    Slide deck showcasing KWL chart layouts with colorful sections in purple, yellow, and teal, for structured insights.
    Add to Wishlist
    Download
    AI Customize
    Chart guide slide with two green-tone line graphs displaying data points, captions on the right, and a text footer.
    Free
    Add to Wishlist
    Download
    AI Customize
    Pie chart illustration showcasing five data segments in varying colors with percentage labels and connected captions areas.