MILESTONE 🌟 5 Million+ creative minds trust SlideEgg! Grab 80% OFF

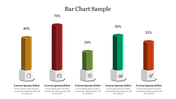
Multicolored 3D Shaped Chart PowerPoint Template

3D bar chart with four vertical bars in blue, teal, purple, and yellow, with percentage labels and captions for each.
P.ID : 46576
    121 views
    21 Downloads
    Get Custom Slides by Experts
    Instantly Access Templates in PowerPoint

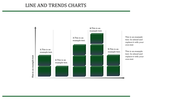
    Attractive 3D Shapes Templates


    We think that you have so much to present at the business meeting, so to make our work creative and unique, SlideEgg has come with attractive 3D Shapes Chart templates. These are the colorful template that will make your work stand out. In addition, it will help you create a visually appealing PowerPoint presentation in a second. 3D shapes are the cup of cake for PowerPoint presentations.


    This 3D Shapes Chart PowerPoint template is designed using multicolor themes. It is a four-noded template with a bright background. This template will not waste your time in presenting information because it is designed with all ready-to-use data. You can create a one-minute presentation using our pre-designed 3D shapes templates. Break your hard times by downloading this creative template from SlideEgg.


    Features of this template


    • It is 100% customizable and straightforward to download.
    • The Slides are available in different nodes & colors.
    • The Slide contained 16:9 and 4:3 format.
    • It is easy to change the slide colors quickly.
    • It is a well-crafted template with an instant download facility.
    • The best 3D PowerPoint template.

    Advertisement

    You May Also Like These PowerPoint Templates

    Add to Wishlist
    Download
    AI Customize
    Change curve diagram mapping emotional responses over time, with stages from shock and denial along a wavy line.
    Add to Wishlist
    Download
    AI Customize
    Innovative Cockpit Charts PowerPoint Download PPT Slides
    Add to Wishlist
    Download
    AI Customize
    A line chart  slide showing data trends across seven items with two percentage indicators with icons and caption areas.
    Free
    Add to Wishlist
    Download
    AI Customize
    Color-coded Gantt chart template for project management, displaying four phases across quarters with colorful text boxes.
    Add to Wishlist
    Download
    AI Customize
    Three outlined boxes in yellow, red, and green, each with circles labeled K, W, and L, at the bottom.
    Add to Wishlist
    Download
    AI Customize
    KPI dashboard template with six sections which includes charts, graphs, and numerical data.
    Add to Wishlist
    Download
    AI Customize
    KPI Infographics PowerPoint And Google Slides Themes
    Add to Wishlist
    Download
    AI Customize
    A project management dashboard slide featuring a table of test case data alongside visual graphs and planned progress.
    Add to Wishlist
    Download
    AI Customize
    A dynamic slide layout featuring a circular pie chart, with labeled segments and placeholder text.
    Add to Wishlist
    Download
    AI Customize
    Two line graphs comparing data trends with different colors, featuring seven data points on each chart.
    Add to Wishlist
    Download
    AI Customize
    Colorful circle chart depicting percentage distribution across four categories, with accompanying captions for each segment.
    Add to Wishlist
    Download
    AI Customize
    Colorful business analytics dashboard displaying bar graphs, line charts, and percentage indicators in a structured layout.
    Add to Wishlist
    Download
    AI Customize
    Stacked column chart with three categories, percentage labels, and circular step icons on both sides with percentage figures.
    Add to Wishlist
    Download
    AI Customize
    A stock chart with five vertical bars in orange and teal, representing financial data for a day period.
    Add to Wishlist
    Download
    AI Customize
    Line chart with labeled high and low points across a fluctuating path, illustrating peaks and troughs in data trends.
    Add to Wishlist
    Download
    AI Customize
    Dashboard layout with income, expenses, profit, and cash flow figures on the left, a project budget chart in the center.
    Add to Wishlist
    Download
    AI Customize
    Dashboard template with pink charts showing facebook and twitter activity, percentage rings, and a page growth graph.
    Add to Wishlist
    Download
    AI Customize
    Line chart template with two lines and labeled data points, along with caption blocks on the left.