Customizable Dashboard Presentation Template and Google Slides

Dashboard presentation template showing four gauges labeled Learning and Growth, Customer, Financial, and Business Process.
P.ID : 18832
    347 views
    22 Downloads
    Get Custom Slides by Experts
    Instantly Access Templates in PowerPoint

    Customizable Dashboard Presentation Template and Google Slides


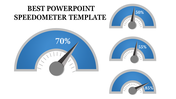
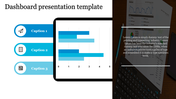
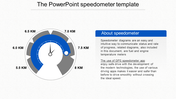
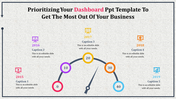
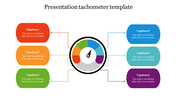
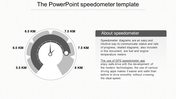
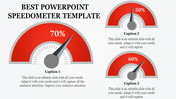
    The Dashboard Presentation PowerPoint template and Google Slides theme feature four speedometers, each representing different aspects like finance, business, customer, and learning/growth. The speedometers are in blue color, set against a white background for clear visibility.

    This template is ideal for presenting key performance indicators (KPIs) or metrics in a visually engaging manner. The use of speedometers conveys the idea of monitoring and measuring progress in various areas, and the blue color scheme adds a sense of professionalism and reliability.

    Each speedometer can be customized to represent specific metrics or goals relevant to your presentation. Whether it's financial performance, business operations, customer satisfaction, or organizational growth, this template provides a clear and visually appealing way to display data and insights.

    Fully customizable, users can adjust colors, fonts, and layout elements to suit their specific needs and preferences. Whether used for internal reporting, client presentations, or executive meetings, the Dashboard template offers an effective tool for tracking and communicating key performance information.

    Features of the template

    • 100% customizable slides and easy to download.
    • Slides are available in different nodes & colors.
    • The slide contains 16:9 and 4:3 formats.
    • It is easy to change the colors of the slide quickly. 
    • Well-crafted template with an instant download facility.
    Advertisement

    You May Also Like These PowerPoint Templates

    Add to Wishlist
    Download
    AI Customize
    Business executive dashboard template displaying project information, including date and editor with placeholder text.
    Add to Wishlist
    Download
    AI Customize
    Dashboard themed slide with a semi circular gauge showing four icons for speedometers and a central needle pointer.
    Add to Wishlist
    Download
    AI Customize
    Dashboard layout with gauges, bar charts, line graphs, and progress indicators for business performance metrics.
    Add to Wishlist
    Download
    AI Customize
    Green speedometer graphics illustrating performance levels at 70, 50, 55, and 85 percent in a PowerPoint template.
    Add to Wishlist
    Download
    AI Customize
    A tachometer graphic for PowerPoint, featuring different colored sections and text placeholders.
    Add to Wishlist
    Download
    AI Customize
    Four yellow speedometer graphics showing percentages of 70%, 50%, 55%, and 85% placed in a white background.
    Add to Wishlist
    Download
    AI Customize
    Dashboard PowerPoint template with progress bars, circular steps, and a multi color bar chart for tracking metrics.
    Add to Wishlist
    Download
    AI Customize
    Dashboard template showing last deposit, transaction, payment types, and data market percentages.
    Add to Wishlist
    Download
    AI Customize
    Colorful speedometer PPT slide with a gauge showing 25 percent and corresponding happy and sad faces with captions.
    Add to Wishlist
    Download
    AI Customize
    Business leadership slide with a table layout showing five titles and corresponding lists, each filled with content.
    Add to Wishlist
    Download
    AI Customize
    Logistics performance dashboard with two circular charts for failure distribution and delivery tracking, and a gauge meter.
    Add to Wishlist
    Download
    AI Customize
    Tachometer PPT slide with 4 colorful gauges in red, orange, green, and blue, each with caption sections on a white backdrop.
    Add to Wishlist
    Download
    AI Customize
    Dashboard PowerPoint slide featuring pie, bar, and line charts with placeholder text and data visualization.
    Free
    Add to Wishlist
    Download
    AI Customize
    Business slide featuring a circular layout with four orange sections and icons representing key aspects of business.
    Add to Wishlist
    Download
    AI Customize
    Color coded modern dashboard gauge with six labeled sections and a central pointer with captions.
    Add to Wishlist
    Download
    AI Customize
    KPI dashboard slide with key metrics for business, development, and downloads, showing percentages with icons.
    Add to Wishlist
    Download
    AI Customize
    KPI slide displaying a financial table for FY 2018, with figures for Net Sales, Income, and Expenses for each quarter.
    Free
    Add to Wishlist
    Download
    AI Customize
    Free KPI PPT Template For Presentation & Google Slides