Innovative Executive Dashboard PowerPoint Template Slides

Business executive dashboard template displaying project information, including date and editor with placeholder text.
P.ID : 3849
    909 views
    25 Downloads
    Get Custom Slides by Experts
    Instantly Access Templates in PowerPoint

    Dashboard PowerPoint Template and Google Slides

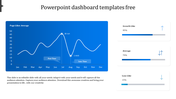
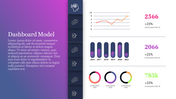
    The "Dashboard PowerPoint Template and Google Slides" offers a sleek and professional design suitable for creating dynamic dashboard presentations. It features a dark purple background with a light purple gradient at the top, providing a visually appealing backdrop. In the center of the slide, there's a white box outlined with a blue border, divided into four columns. Users can customize the content, including the date and name, to align with their specific presentation needs.

    This template is ideal for business executives, project managers, data analysts, and professionals across various industries who need to showcase key metrics, performance indicators, or project progress in a visually engaging dashboard format.

    Compatibility with PowerPoint and Google Slides. Available in 16:9 and 4:3 aspect ratios, catering to different screen sizes and presentation preferences. Provided in ZIP format for easy sharing and distribution. Free template with 100% customizable features. Download now.
    Advertisement

    You May Also Like These PowerPoint Templates

    Add to Wishlist
    Download
    AI Customize
    Creative KPI Dashboard PPT And Google Slides Template
    Add to Wishlist
    Download
    AI Customize
    Executive dashboard slide displaying many charts from new business to operational expenses.
    Add to Wishlist
    Download
    AI Customize
    Dashboard template with a semi-circular gauge indicating performance with a blurred image and caption areas.
    Add to Wishlist
    Download
    AI Customize
    Dashboard slide showing plant growth data with details table and area chart for Zantedeschia, Celosia, and Calendula.
    Add to Wishlist
    Download
    AI Customize
    Colorful Tachometer slide with color coded sections from light to BMI with placeholder text.
    Add to Wishlist
    Download
    AI Customize
    Slide with three tachometer dials in blue, purple, and pink, each aligned above a matching caption box.
    Add to Wishlist
    Download
    AI Customize
    Dashboard graphics displaying vehicle speeds with a data table listing vehicles, brands, and status.
    Free
    Add to Wishlist
    Download
    AI Customize
    Four vertical pointed icons in red, blue, purple, and orange, each aligned with caption on a light background.
    Add to Wishlist
    Download
    AI Customize
    Project dashboard slides with Gantt chart, a burndown chart, and a timeline, using a palette of brown, green, and red.
    Add to Wishlist
    Download
    AI Customize
    Tachometer PowerPoint slide with gauges indicating 10, 20, and 30 with captions for each.
    Add to Wishlist
    Download
    AI Customize
    Concentric pentagons in black with text areas around each corner, forming a simple monochrome layout.
    Add to Wishlist
    Download
    AI Customize
    Horizontal infographic with four tachometer icons in gradient colors, labeled with captions for each gauge.
    Add to Wishlist
    Download
    AI Customize
    Slide featuring a tachometer dial with four performance levels and linked captions in red, yellow, maroon, and blue.
    Add to Wishlist
    Download
    AI Customize
    Dashboard layout with charts in orange tones, including a donut chart, bar graphs, and a line chart for monthly data.
    Add to Wishlist
    Download
    AI Customize
    Slide with four red speedometers, each indicating a different percentage level, against a white background.
    Add to Wishlist
    Download
    AI Customize
    Key performance indicator slide displaying data bars, percentages, and distinct icons in a structured layout.