Stunning PowerPoint Speedometer template and Google slides

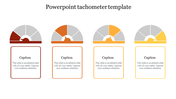
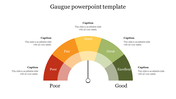
Captivating PPT Speedometer template presentation
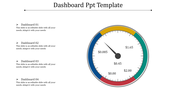
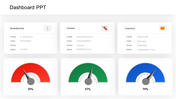
Imagine ditching presentations that leave your audience lost in a maze of numbers. This PowerPoint speedometer template is your secret weapon for creating slides that showcase your progress in a clear and exciting way!
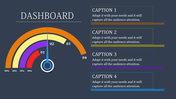
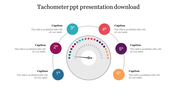
Picture a slide with two cool speedometer dials, like the ones in your car. They're like handy tools to track how far you've come. There's also space to add your key points for each one.
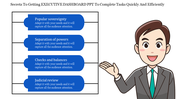
This is perfect for anyone who wants to show their progress clearly, from business folks presenting results to teachers tracking student achievement, or even marketing teams showcasing campaign success.
No more boring presentations with just text blocks! This creative template lets you showcase your progress in a way that'll grab attention and keep people hooked. Seeing is believing, after all!
Stop wasting time on presentations that confuse people. Download this speedometer template today and create presentations that are both informative and eye-catching! Plus, they're super easy to customize to fit any topic you want to cover. Get ready to transform your presentations from confusing charts to clear and exciting progress trackers in no time!
Features of the template
- 100% customizable slides and easy to download.
- The slides contain 16:9 and 4:3 formats.
- Easy to change the colors quickly.
- It is a well-crafted template with an instant download facility.
- It is a 100% pre-designed slide.
- The slide holds vibrant colors.


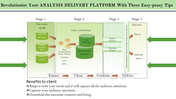
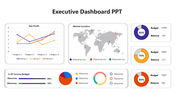
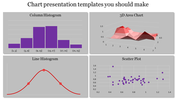
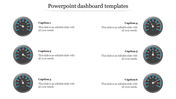
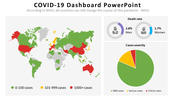
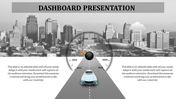
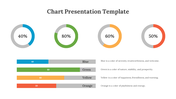
You May Also Like These PowerPoint Templates
Add to Wishlist
Download
AI Customize

Add to Wishlist
Download
AI Customize

Add to Wishlist
Download
AI Customize

Add to Wishlist
Download
AI Customize

Add to Wishlist
Download
AI Customize

Add to Wishlist
Download
AI Customize

Add to Wishlist
Download
AI Customize

Add to Wishlist
Download
AI Customize

Add to Wishlist
Download
AI Customize

Add to Wishlist
Download
AI Customize

Add to Wishlist
Download
AI Customize

Free
Add to Wishlist
Download
AI Customize

Add to Wishlist
Download
AI Customize

Add to Wishlist
Download
AI Customize

Add to Wishlist
Download
AI Customize

Add to Wishlist
Download
AI Customize

Add to Wishlist
Download
AI Customize

Add to Wishlist
Download
AI Customize

Add to Wishlist
Download
AI Customize

