Exceptional Dashboard Presentation Template Diagram

Dashboard with a multi-colored semicircular gauge divided into four sections, labeled 01 to 04, and captions on the right.
P.ID : 10288
    484 views
    54 Downloads
    Get Custom Slides by Experts
    Instantly Access Templates in PowerPoint

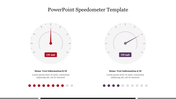
    Elevate Insights with Exceptional Dashboard PowerPoint Templates


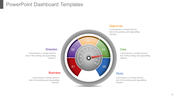
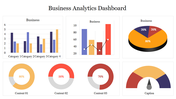
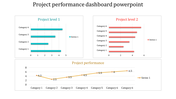
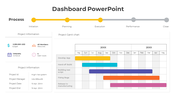
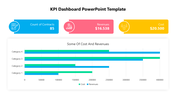
    Transform your data into compelling visuals with our Exceptional Dashboard Presentation Template Diagram. This versatile template features four nodes, each in a vibrant multi-color theme, making it easy to differentiate and highlight key metrics. Designed with dashboard-themed graphic icons, this template is perfect for showcasing business insights, performance metrics, and analytical data in a clear and engaging manner. The user-friendly layout allows you to effortlessly present complex information, ensuring your audience can quickly grasp and interpret the data. Ideal for business professionals, analysts, and managers, this template helps you deliver impactful presentations that drive decision-making and demonstrate your expertise. Download now to enhance your presentations with this exceptional dashboard template and make your data stories come to life.


    Features of this template:

    • 100% customizable slides and easy to download.
    • Slides available in different nodes & colors.
    • The slide contained 16:9 and 4:3 format.
    • Easy to change the slide colors quickly.
    • Well-crafted template with instant download facility.

    Advertisement

    You May Also Like These PowerPoint Templates

    Add to Wishlist
    Download
    AI Customize
    Tachometer template with percentage markers and color-coded designs, each paired with caption areas.
    Add to Wishlist
    Download
    AI Customize
    Executive dashboard template showcasing growth, progress, and performance metrics for effective management.
    Add to Wishlist
    Download
    AI Customize
    Dashboard slide with two green gauge meters, each labeled with a caption and text below.
    Add to Wishlist
    Download
    AI Customize
    Microsoft dashboard slide showcasing supply chain costs, inventory to sales ratio, and carrying cost of inventory.
    Add to Wishlist
    Download
    AI Customize
    PowerPoint slide featuring a project dashboard with bar charts and a pie chart displaying project data and progress.
    Add to Wishlist
    Download
    AI Customize
    Project status dashboard slide displaying budgets and performance metrics for banners, social media, and brochures.
    Add to Wishlist
    Download
    AI Customize
    PowerPoint slide with a tachometer graphic showing numbers 1 through 8 in different colors, with placeholders for captions.
    Add to Wishlist
    Download
    AI Customize
    Colorful tachometer PowerPoint slide design with transportation icons including airplane, car, bus, and train with captions.
    Add to Wishlist
    Download
    AI Customize
    Ten speedometer icons in two rows, each with blue, green, and red segments, ranging from 0 to 100.
    Add to Wishlist
    Download
    AI Customize
    Tachometer slide with four gauges in orange, red, blue, and green, each with captions below describing different readings.
    Add to Wishlist
    Download
    AI Customize
    Dashboard with bar charts, line graphs, and a gauge chart in various colors and a percentage indicator, on white background.
    Add to Wishlist
    Download
    AI Customize
    Dashboard template with three fuel gauge icons, each showing different fuel levels with placeholder text.
    Add to Wishlist
    Download
    AI Customize
    KPI dashboard layout with a yellow header, two gauge in teal and green, bar metrics, and pie charts on a light background.
    Add to Wishlist
    Download
    AI Customize
    Seven rectangular sections with financial data on top and visual charts below, bordered in blue with organized text.
    Add to Wishlist
    Download
    AI Customize
    KPI slide table with yearly financial data from FY16 to FY19 from operations to cash equivalents with placeholder text.
    Add to Wishlist
    Download
    AI Customize
    Key performance indicator slide displaying data bars, percentages, and distinct icons in a structured layout.