Project Summary Dashboard PPT Template for Overview Reports


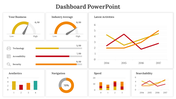
Dashboard PowerPoint Template and Google Slides
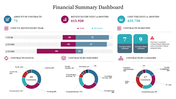
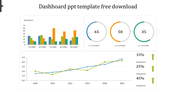
Introducing the "Dashboard PowerPoint Template and Google Slides": This template features a project summary dashboard designed to visually represent key project metrics and progress. The dashboard comprises three main sections: a pie chart showing the percentage of work completed in each quarter, a bar chart forecasting work completion for upcoming quarters, and a table detailing tasks currently in progress.
This template is ideal for project managers, team leaders, or anyone involved in project management seeking to effectively communicate project status and progress to stakeholders. Whether used in project meetings, status updates, or presentations to clients or management, it provides a clear and concise overview of project performance.
Compatibility with PowerPoint and Google Slides. Available in 16:9 and 4:3 aspect ratios, catering to different screen sizes and presentation preferences. Provided in ZIP format for easy sharing and distribution. Free template with 100% customizable features. Download now.


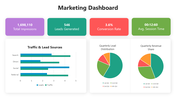
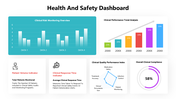
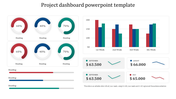
You May Also Like These PowerPoint Templates
Add to Wishlist
Download
Edit

Add to Wishlist
Download
Edit

Add to Wishlist
Download
Edit


Add to Wishlist
Download
Edit


Add to Wishlist
Download
Edit


Add to Wishlist
Download
Edit

Add to Wishlist
Download
Edit

Add to Wishlist
Download
Edit

Add to Wishlist
Download
Edit


Add to Wishlist
Download


Add to Wishlist
Download
Edit

Add to Wishlist
Download
Edit


