Attractive PowerPoint KPI Dashboard Presentation Template

Attractive PowerPoint KPI Dashboard Presentation Template
P.ID : 46989
    454 views
    54 Downloads
    Get Custom Slides by Experts
    Instantly Access Templates in PowerPoint

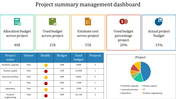
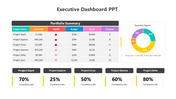
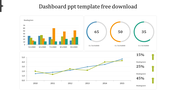
    Attractive Dashboard Slide For Presentation 

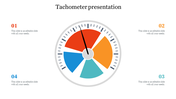
    Once you plan to take a car for a ride, what will you do? You will check for the fuel, engine temperature, air in the tire, and side mirrors, and if you fail to check all the above things, it will lead you to severe mishaps. Isn't it? You can quickly get all the information about your car when looking at the dashboard. The dashboard can give you complete information about your car's health. Also, business requires a perfect KPI Dashboard to analyze, visualize, and group-specific values to enhance business performance. Get this dashboard slide to track the performance of your business. The slide is flexible to edit. 

    Features of the template 

    • 100% customizable slides and easy to download.
    • Slides are available in different nodes & colors.
    • The slide contained 16:9 and 4:3 formats.
    • Easy to change the slide colors quickly.
    • It is a well-crafted template with an instant download facility.
    • Mind-blowing slide for the PowerPoint.
    • Best presentation slide.
    Advertisement

    You May Also Like These PowerPoint Templates

    Add to Wishlist
    Download
    AI Customize
    Dashboard Model PowerPoint slide showing statistics, graphs, and icons representing business data analysis.
    Add to Wishlist
    Download
    AI Customize
    KPI dashboard showcasing private school growth with yellow bar charts indicating critical, low, none, and high levels.
    Add to Wishlist
    Download
    AI Customize
    Dashboard slide with six gauge meters displaying low to high ranges, each labeled with captions below.
    Add to Wishlist
    Download
    AI Customize
    Circular tachometer design with a central gauge and surrounding colored segments, each linked to captions on the right.
    Add to Wishlist
    Download
    AI Customize
    Dashboard slide showing colour coded plant growth chart with progress ring visuals and percentages.
    Add to Wishlist
    Download
    AI Customize
    Dashboard slide showing sales bar chart with a highlighted value and a gauge representing business metrics.
    Add to Wishlist
    Download
    AI Customize
    Financial dashboard with bar charts in pink and blue, colored circular pie charts, and teal boxes highlighting metrics.
    Add to Wishlist
    Download
    AI Customize
    Speedometer template with a needle pointing at 70%, featuring a section in a whote backdrop for a caption areas.
    Add to Wishlist
    Download
    AI Customize
    Speedometer template with four gauges displaying percentages: blue at 70%, orange at 50%, dark red at 55%, and red at 85%.
    Add to Wishlist
    Download
    AI Customize
    Project dashboard with colorful bar charts, tables in red and purple, a circular gauge, and four blue phase icons below.
    Free
    Add to Wishlist
    Download
    AI Customize
     Row of colorful tachometers with different needle positions, each paired with a corresponding caption box.
    Add to Wishlist
    Download
    AI Customize
    Creative KPI Dashboard PPT And Google Slides Template
    Add to Wishlist
    Download
    AI Customize
    Executive dashboard slide displaying many charts from new business to operational expenses.
    Add to Wishlist
    Download
    AI Customize
    Dashboard template with a semi-circular gauge indicating performance with a blurred image and caption areas.
    Add to Wishlist
    Download
    AI Customize
    Dashboard slide showing plant growth data with details table and area chart for Zantedeschia, Celosia, and Calendula.