Explore Now! Speedometer Plan Presentation Template Design

Speedometer plan template with circular meters at 25%, 50%, and 75%, with caption areas placed in a white background.
P.ID : 51854
    326 views
    29 Downloads
    Get Custom Slides by Experts
    Instantly Access Templates in PowerPoint

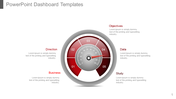
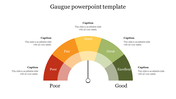
    Effective speedometer plan presentation


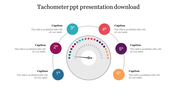
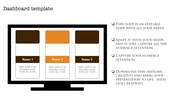
    Try using this speedometer plan presentation template design template for your exclusive presentation. This template is added with three nodes that you can use for explaining your topic.

    The template is neat and creative, with a semi-circle design that you can use for your business presentation. The template is unique, with small icons that can show the critical points.

    You can also use the template for the business model topics and other conferences. Since this template is added with vibrant colors, it enriches the template.

    Since this template is fully customized, it is easier to edit and download. Download this exclusive user-friendly template to add more features to the same template. Grab now!.

    Features of this Template:

    1. 100% customizable slides
    2. easy to download.
    3. Slides available in different nodes & colors.
    4. The slide contained 16:9 and 4:3 formats.
    5. Easy to change the slide colors quickly.
    6. Well-crafted template with instant download facility.
    7. Creative design with text area.

    Advertisement

    You May Also Like These PowerPoint Templates

    Free
    Add to Wishlist
    Download
    AI Customize
    Pie chart in orange, red, green, and blue sections with two text labels on either side, highlighting sales performance.
    Add to Wishlist
    Download
    AI Customize
    Attractive PowerPoint KPI Dashboard Presentation Template
    Add to Wishlist
    Download
    AI Customize
    Dashboard gauge chart PPT template with color coded sections for big loss, loss, break even, profit, and high profit.
    Add to Wishlist
    Download
    AI Customize
    Internet speed dashboard featuring two routers with speed performance indicators and mobile phones.
    Free
    Add to Wishlist
    Download
    AI Customize
    Green radial gauge with a modern layout, surrounded by five labeled rectangular sections on a neutral background.
    Add to Wishlist
    Download
    AI Customize
    Colorful dashboard PPT slide with world map, pie charts, bar graphs, and metrics with placeholder text.
    Free
    Add to Wishlist
    Download
    AI Customize
    Dashboard template with three colorful gauge icons in the center and text boxes in green, blue, and gold.
    Free
    Add to Wishlist
    Download
    AI Customize
    PowerPoint slide with a project dashboard showing two speedometers to represent project progress with captions.
    Free
    Add to Wishlist
    Download
    AI Customize
    Dashboard PPT template featuring a speedometer with labeled sections like Direction, Objectives, Data, Business, and Study.
    Add to Wishlist
    Download
    AI Customize
    KPI template showing a bar chart with four cases, and two circular progress indicators in blue and orange showing percentage.
    Add to Wishlist
    Download
    AI Customize
    A slide displaying dashboard elements like bar graphs, a world map with data points, and progress bars, with captions.
    Add to Wishlist
    Download
    AI Customize
    Marketing KPI dashboard comparing Google, Facebook, and Bing ads, featuring clicks, cost, line charts, and campaign analysis.
    Add to Wishlist
    Download
    AI Customize
    Orange speedometer slide with a gauge showing 70% progress and space for caption text below.
    Free
    Add to Wishlist
    Download
    AI Customize
    Tachometer PowerPoint slide featuring a colorful gauge with segments labeled with space for captions on a white backdrop.
    Add to Wishlist
    Download
    AI Customize
    Dashboard slide with metrics for social media, including followers, engagement, impressions, and reviews in charts.
    Add to Wishlist
    Download
    AI Customize
    Executive dashboard slide displaying colorful charts for executing dashboard to quality.