Dashboard Templates for PowerPoint Slide Presentations

Dashboard with a red line graph for Jan-May and a bar chart of four colored percentage bars and category icons.
P.ID : 52631
    341 views
    47 Downloads
    Get Custom Slides by Experts
    Instantly Access Templates in PowerPoint

    Dashboard Presentation Slide

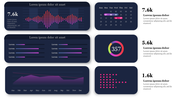
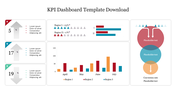
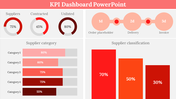
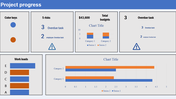
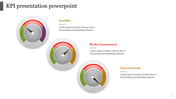
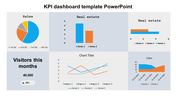
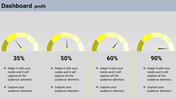
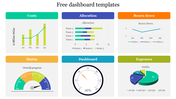
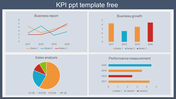
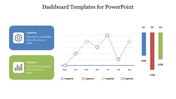
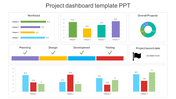
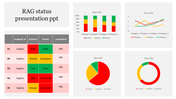
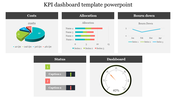
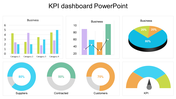
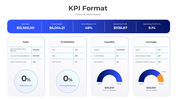
    A dashboard is a user interface that provides a real-time visual representation of key performance indicators and metrics for an organization. It is a single page that provides a summary of all the important data that an organization needs to keep track of. Dashboards can be customized to show specific data sets and can include charts, graphs, and tables to make it easy to understand and interpret. You can use this template if you want to explain this idea to your audience.

    Features of the Template

    • 100% customizable slides and easy to download
    • The slides contained 16:9 and 4:3 formats.
    • Well-crafted template with instant download facility.
    • Attractive animations and nodes.
    • Informative three nodes.
    Advertisement

    You May Also Like These PowerPoint Templates

    Add to Wishlist
    Download
    AI Customize
    Three speedometer charts slide with captions indicating different data points, highlighted in green, yellow, and orange.
    Free
    Add to Wishlist
    Download
    AI Customize
    Free Dashboard PowerPoint Template Design template
    Add to Wishlist
    Download
    AI Customize
    Three semi circle gauges in pastel colors, with percentage labels above, and related text and icons beneath.
    Add to Wishlist
    Download
    AI Customize
    Three speedometers showing progress percentages: 25%, 50%, and 75%, with gradient colors in yellow, orange, and red.
    Add to Wishlist
    Download
    AI Customize
    Online marketing dashboard slide showing graphs for TV Media, Facebook, Direct Marketing, and YouTube performance.
    Add to Wishlist
    Download
    AI Customize
    Metrics Dashboard PowerPoint Template & Google Slides
    Free
    Add to Wishlist
    Download
    AI Customize
    Slide with three gauge meters in orange, yellow, and gray, each paired with a table for KPI metrics.
    Free
    Add to Wishlist
    Download
    AI Customize
    KPI presentation template displaying colorful charts for revenue, units sold, and product category analysis.
    Free
    Add to Wishlist
    Download
    AI Customize
    Effective Project Dashboard PowerPoint Presentation
    Free
    Add to Wishlist
    Download
    AI Customize
    Project management dashboard slide showing various tasks in planning, design with workload, and budget charts.
    Free
    Add to Wishlist
    Download
    AI Customize
    Real estate KPI dashboard showing quarterly data in a green colored pie chart and bar graphs across various categories.
    Add to Wishlist
    Download
    AI Customize
    Speedometer clipart slide featuring three gauges at 25%, 50%, and 75% with space for descriptive text below each.
    Free
    Add to Wishlist
    Download
    AI Customize
    KPI slide displaying key performance indicators with many sections and accompanying data charts.
    Add to Wishlist
    Download
    AI Customize
    Dashboard slide showcasing project management KPIs with bar graphs, a line graph, and a pie chart in different colors.
    Add to Wishlist
    Download
    AI Customize
    Project management dashboard with charts for budget, progress, risks, workload, and projected launch date and icons.
    Add to Wishlist
    Download
    AI Customize
    PowerPoint slide with KPI dashboard metrics, including revenue, sales by month, and customer revenue comparison.
    Free
    Add to Wishlist
    Download
    AI Customize
    KPI Dashboard with bubbles for sales, attendance, download, and report and a client location legend.